The Fed members keep on repeating the same thing: they skipped the June hike because they wanted to see more data before deciding on further tightening. Although the majority of them anticipates two rate hikes this year, they continually stress that these decisions are contingent upon the data. Just yesterday, Fed Chair Powell reiterated the resilience of the economy and expressed openness to the possibility of two or more consecutive rate hikes if the labour market remains strong.
The data received following the last FOMC meeting strengthens the case that we will indeed see further rate hikes. The housing market data was very strong, the US Jobless Claims remain stable, the US Services PMI continues to show expansion, and the latest Consumer Confidence report beat expectations by a big margin. Naturally, much will depend on the forthcoming NFP and CPI reports. However, if we continue to get such good data, the Fed will indeed increase rates twice instead of the market's current expectation of a single hike in July.
Russell 2000 Technical Analysis – Daily Timeframe
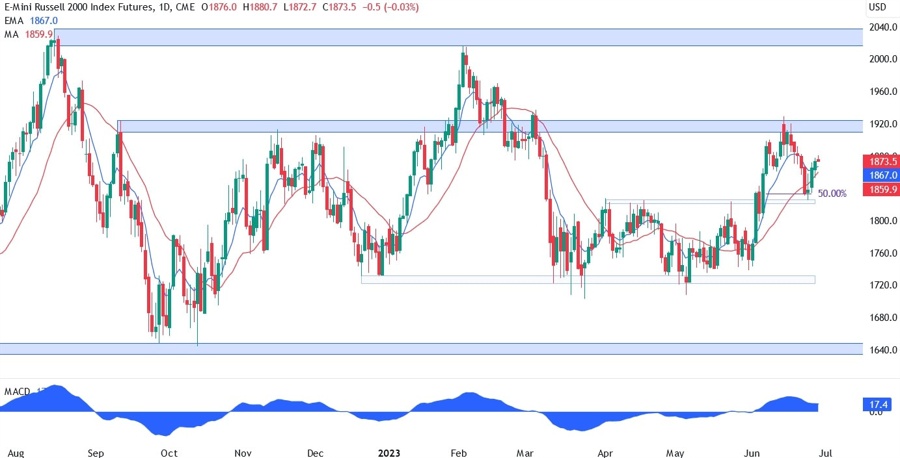
On the daily chart, we can see that the Russell 2000 couldn’t break the 1920 resistance zone and fell all the way back to the previous resistance now turned support at 1820. The price has bounced pretty strongly from this support zone and it now looks like the Russell 2000 is targeting a break above the 1920 resistance. Is this the start of another rally or a dead cat bounce?
Russell 2000 Technical Analysis – 4 hour Timeframe
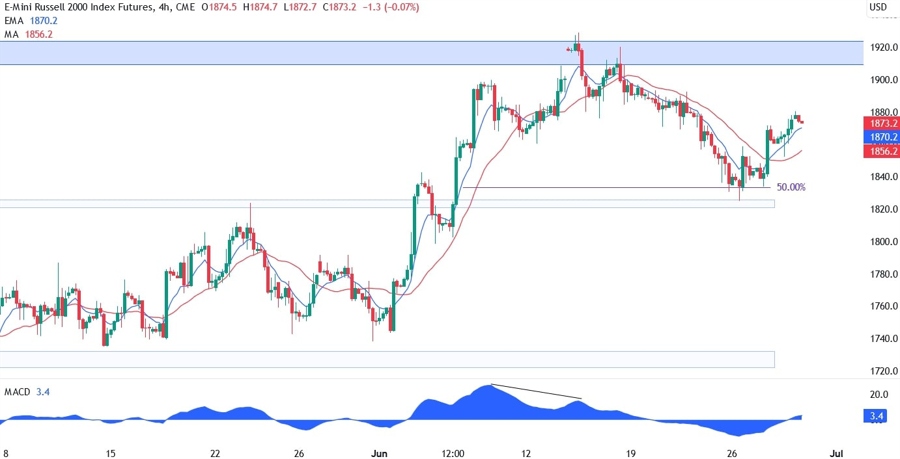
On the 4 hour chart, we can see that we also had a 50% Fibonacci retracement level near the 1820 support which gave more confluence and strength to the level. The moving averages have now crossed again to the upside which signals that the bullish momentum is prevailing. All else being equal, the Russell 2000 can keep on rising barring recessionary fears. Of course, a break below the 1820 support would invalidate the bullish setup and take us quickly back to the 1720 support.
Russell 2000 Technical Analysis – 1 hour Timeframe
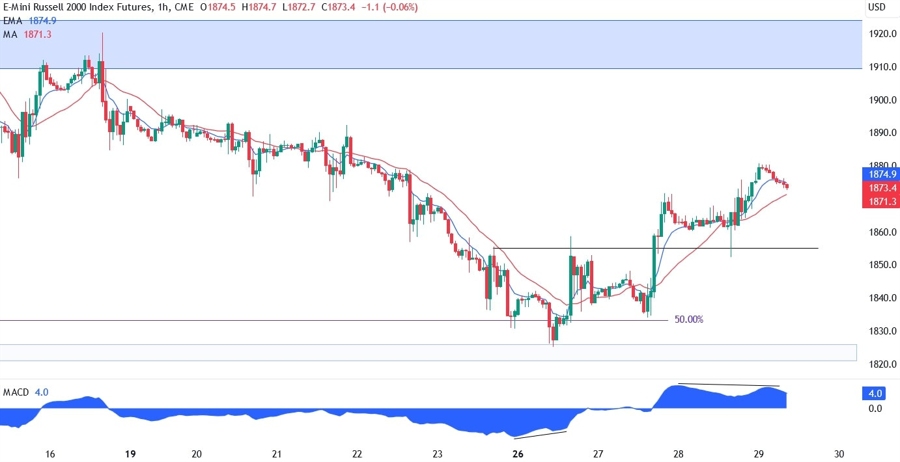
On the 1 hour chart, we can see that the price has recently broke above a swing high, retested it, and then made a new higher high. This is a bullish market structure, but we can also notice that the last leg higher is diverging with the MACD, which is a sign of weakening momentum often followed by pullbacks or reversals. In this case, the price may pull back into the 1855 support where we should see the buyers stepping in with a defined risk below the level and target the 1920 resistance. The sellers, on the other hand, will want to see the price to break below the level to pile in and extend the fall back into the 1820 support and then target further downside into the 1720 low.
On the data front, we have the US Jobless Claims today and the US PCE report tomorrow. Strong readings will reinforce the case for more than one hike, while weak figures may change the Fed’s mind on multiple hikes.