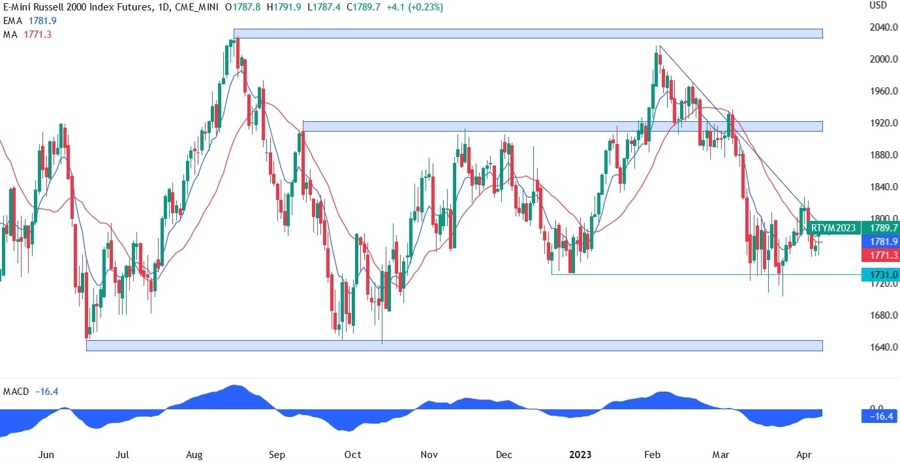
On the daily chart below for Russell 2000, we can see that the first breakout of the trendline failed. The Russell 2000 has been underperforming the other indices as small cap stocks find it harder to rally in this environment and the index is more exposed to the regional bank stocks that continue to be under pressure.
Nevertheless, the more positive sentiment in the market lately kept the index afloat. The key levels to watch are the trendline and the support at 1731. A breakout on one of those can lead to a bigger move afterwards.
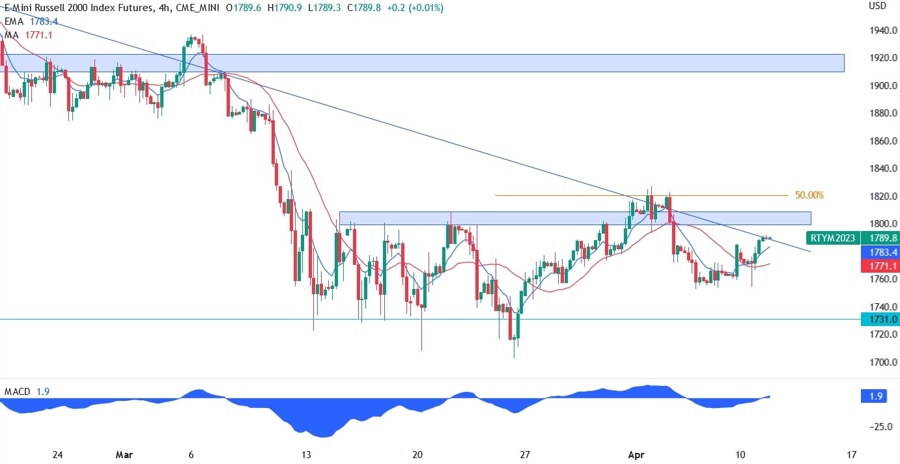
On the 4 hour chart below, we can see that the buyers couldn’t sustain a break above the range as they found the trendline and the 50% Fibonacci retracement level as resistance. In fact, the price fell right back within the range between the support at 1731 and the resistance at 1800. As we approached the Easter Holidays, the price action turned cautious, and the market started to consolidate just below the trendline.
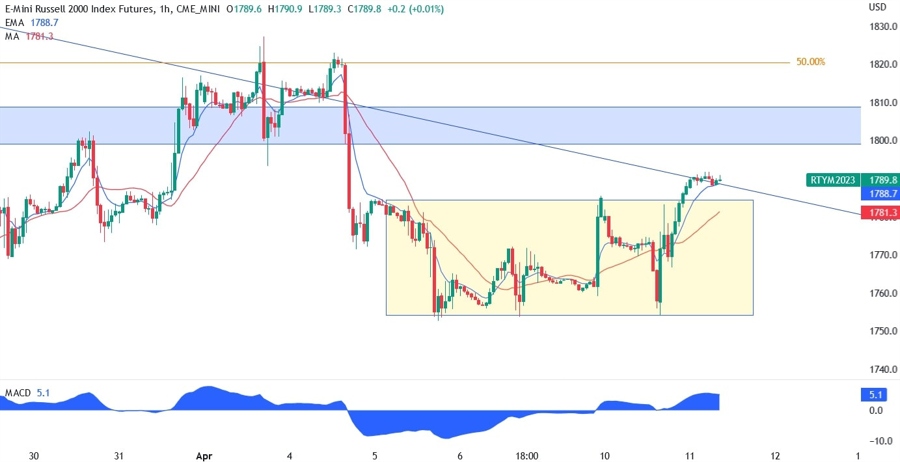
On the 1 hour chart, we can see the mini range highlighted by the yellow rectangle that was breached yesterday. The price is now struggling at the trendline, but the buyers may find enough conviction to keep charging towards the 1800 resistance. If they manage to break above the 1800 resistance again, we may see a more sustained rally.
The sellers, on the other hand, are likely to lean again on the 1800 resistance to defend the level. On a more near-term outlook, if the price falls back within the yellow range, the sellers are likely to extend the move towards the bottom of the range at 1755 and, upon a breakout, target the break below the 1731 support.