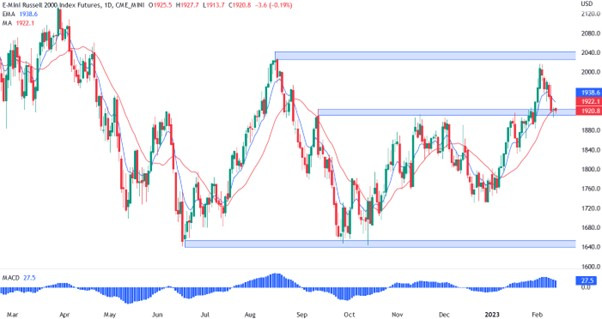
On the daily chart below, we can see that the price couldn’t reach the resistance at 2030 as the strong NFP report awakened fears of persistently high inflation and the need for the Fed to go higher with interest rates hikes.
The price pulled back to the old resistance now turned support at 1920.
We can see that there’s also the red moving average acting as support and keeping the uptrend intact.
A break below the support will give the sellers control.
The CPI report will decide the next move as a beat to the expectations should see the sellers pile in and a miss should give the buyers more conviction for a rally.
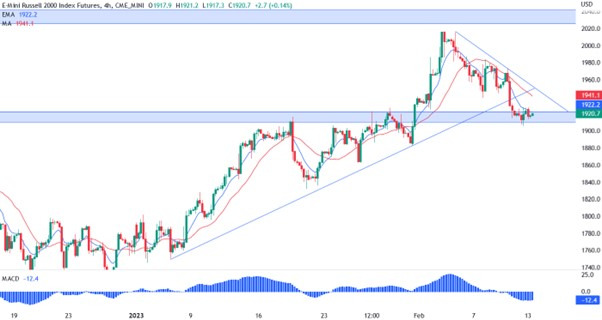
In the 4 hour chart below, we can see that the support at 1920 is the last line of defence for the buyers.
The price has stalled there and it’s now bouncing. We may see a pullback towards the downward sloping trendline and the red moving average before the next big move.
The buyers will need to break that trendline to the upside to have more conviction and target again the resistance at 2030.
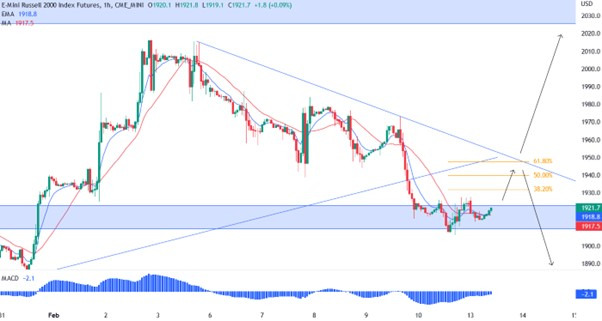
In the 1 hour chart, we can see the possible outcomes in case we get a pullback into the downward sloping trendline.
The price is also printing a possible head and shoulders pattern right at the 1920 support, which may further confirm a move to the trendline.
From a risk management perspective, the sellers will have a better spot at the trendline with also a Fibonacci retracement level acting as resistance.
The risk will be defined as a breakout to the upside will give the buyers more strength and invalidate the short setup.