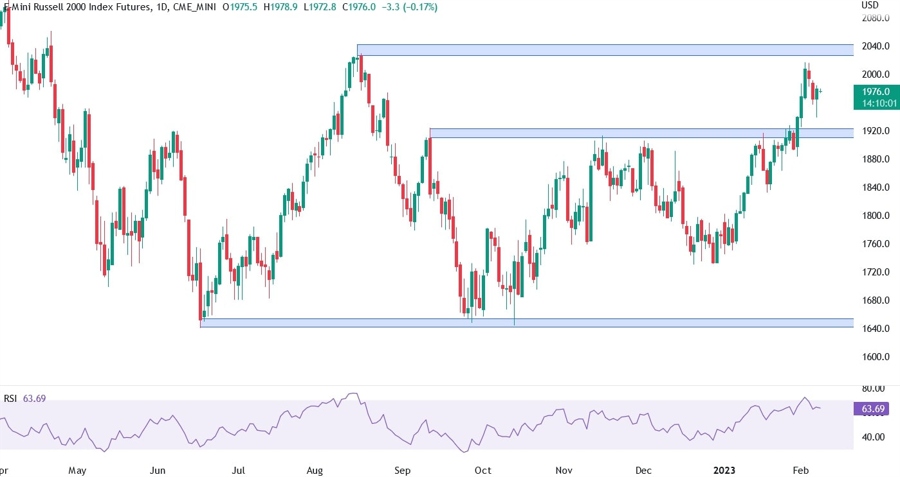
On the daily chart below, we can see that the price pullbacked right before the resistance at 2030 as last Friday’s surprising beat in NFP and ISM Services PMI made the bulls fearful of a more hawkish Fed.
This indeed seems to be the case as recent comments by Fed members like Kashkari or Fed Chair Powell indicated that they may have to go higher on the terminal rate if they see beats in inflation or labour market reports.
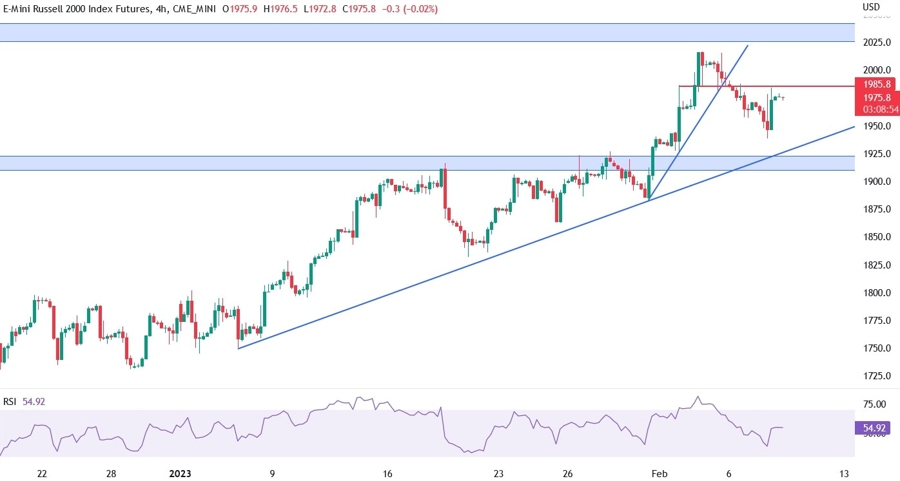
In the 4 hour chart below, we can see that the bullish trend defined by the bigger upward trendline is still intact. The bulls will have more confidence keeping a bullish bias as long as they remain above that trendline and the support at 1920. If the price breaks down those strong barriers, the bears will regain control and target new lows with the support at 1730 as very likely.
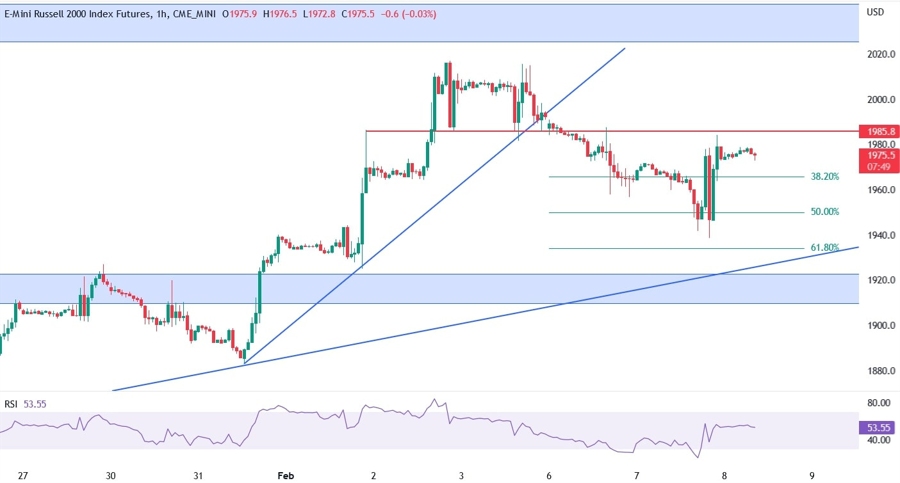
In the 1 hour chart below, we can see that the price broke down the minor trendline and started the pullback towards the major trendline. The near term resistance at 1985 held and we may see another dip towards the major trendline possibly near the 1930 price area where we also have the 61.8% Fibonacci retracement level.
At that point we may also see divergence between the RSI and the price, so it would give the bulls a strong technical setup to try another rally towards the 2030 resistance or even higher. If the price breaks below the major trendline and the support at 1920, the bears will most likely regain control and start targeting new lows.