US:
- The Fed left interest rates unchanged as expected at the last meeting.
- The macroeconomic projections were revised higher as the economy showed much stronger resilience than expected and the Dot Plot showed that the majority of members still expects another rate hike by the end of the year with less rate cuts in 2024.
- Fed Chair Powell reaffirmed their data dependency but added that they will proceed carefully as they are trying to find the optimal level of rates. Powell also added that the soft landing is not the base case atthe moment, although they are aiming for it.
- The latest US Core PCE came in line with expectations with disinflation continuing steady.
- The labour market displayed signs of softening although it remains fairly solid as seen also last week with a strong beat in Jobless Claims and yesterday with the beat in Job Openings.
- The ISM Manufacturing PMI beat expectations in another sign that the US economy remains resilient.
- The market doesn’t expect the Fed to hike again at the moment, but rate cuts continue to be priced out in 2024.
New Zealand:
- The RBNZ kept its official cash rate unchanged while stating that demand growth continues to ease and it’s expected to decline further with monetary conditions remaining restrictive.
- The recent New Zealand inflation and employment data surprised to the upside but the PMIs continue to slide further into contraction.
- The wage growth has also missed expectations and it’s something that the central banks are watching closely.
- The recent New Zealand Retail Sales beat expectations although the data remains deeply negative.
- The RBNZ is expected to keep the cash rate steady at the next meeting as well.
NZDUSD Technical Analysis – Daily Timeframe
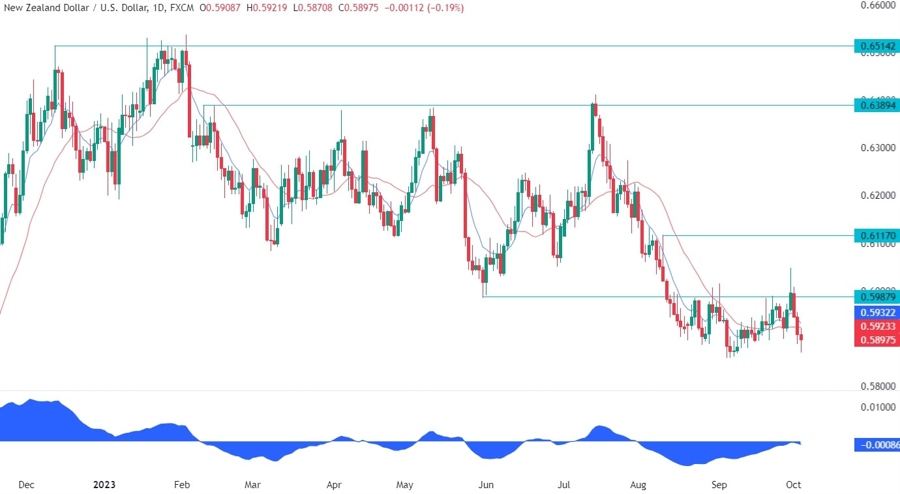
On the daily chart, we can see that the NZDUSD pair tried to break out of the range but got smacked back down to the previous lows. Such rangebound markets are the worst and the best strategy is generally to sit out and wait for a clear breakout supported by a fundamental catalyst to join the trend. Nonetheless, one can also “play the range” by buying at support and selling at resistance.
NZDUSD Technical Analysis – 4 hour Timeframe
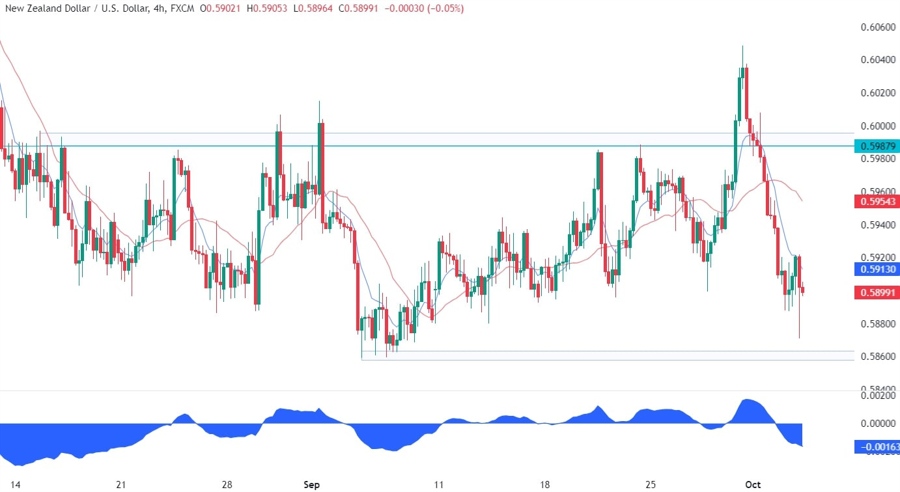
On the 4 hour chart, we can see more closely the range between the 0.5860 support and 0.6000 resistance. There’s no clear level to lean on within the range as the price action remains messy. We can expect the buyers to step in around these levels to target another rally into the upper bound of the range, while the sellers will want to see the price breaking below the support to increase the bearish momentum and target new lows.
NZDUSD Technical Analysis – 1 hour Timeframe
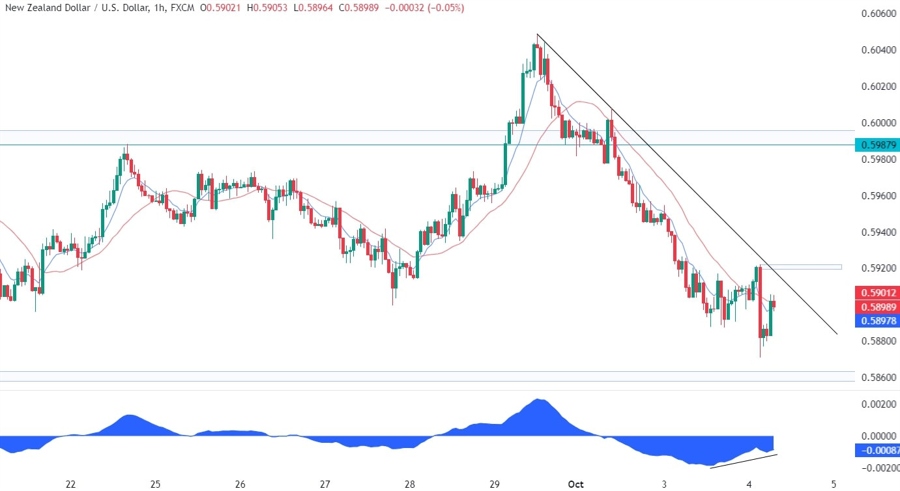
On the 1 hour chart, we can see that on this timeframe we have a clear downtrend as the price has been printing lower lows and lower highs with the moving averages being crossed to the downside. The latest leg lower was caused by the RBNZ policy decision, although it was expected so the price returned to the previous levels after the initial spike. The sellers are likely to pile in around the trendline with a defined risk above it to target a break below the support. The buyers, on the other hand, will want to see the price breaking above the latest lower high around the 0.5920 level to turn the trend around and target another rally into the 0.6000 resistance.
Upcoming Events
Today on the agenda we have the ADP report and the ISM Services PMI. Tomorrow, we will see the latest Jobless Claims data, which continues to show a solid labour market. Finally on Friday, it will be the time for the NFP report which is the only one the Fed will see before its next rate decision.


