USD
- The Fed left interest rates unchanged as expected at the last meeting while dropping the tightening bias in the statement but adding a slight pushback against a March rate cut.
- The US CPI beat expectations for the second consecutive month with the disinflationary trend reversing.
- The US PPI beat expectations across the board by a big margin.
- The US Jobless Claims beat expectations with the data remaining steady.
- The latest US PMIs increased further from the prior month with the Manufacturing PMI beating expectations and the Services PMI missing.
- The US Consumer Confidence missed expectations across the board.
- The market now expects the first rate cut in June.
NZD
- The RBNZ kept its official cash rate unchanged dropping the tightening bias and stating that the OCR will need to remain at restrictive level for a sustained period.
- The latest New Zealand inflation data printed in line with expectations supporting the RBNZ’s patient stance.
- The labour market report beat expectations across the board with lower than expected unemployment rate and higher wage growth.
- The Manufacturing PMI improved in January remaining in contraction while the Services PMI jumped back into expansion.
- The market expects the first cut in August.
NZDUSD Technical Analysis – Daily Timeframe
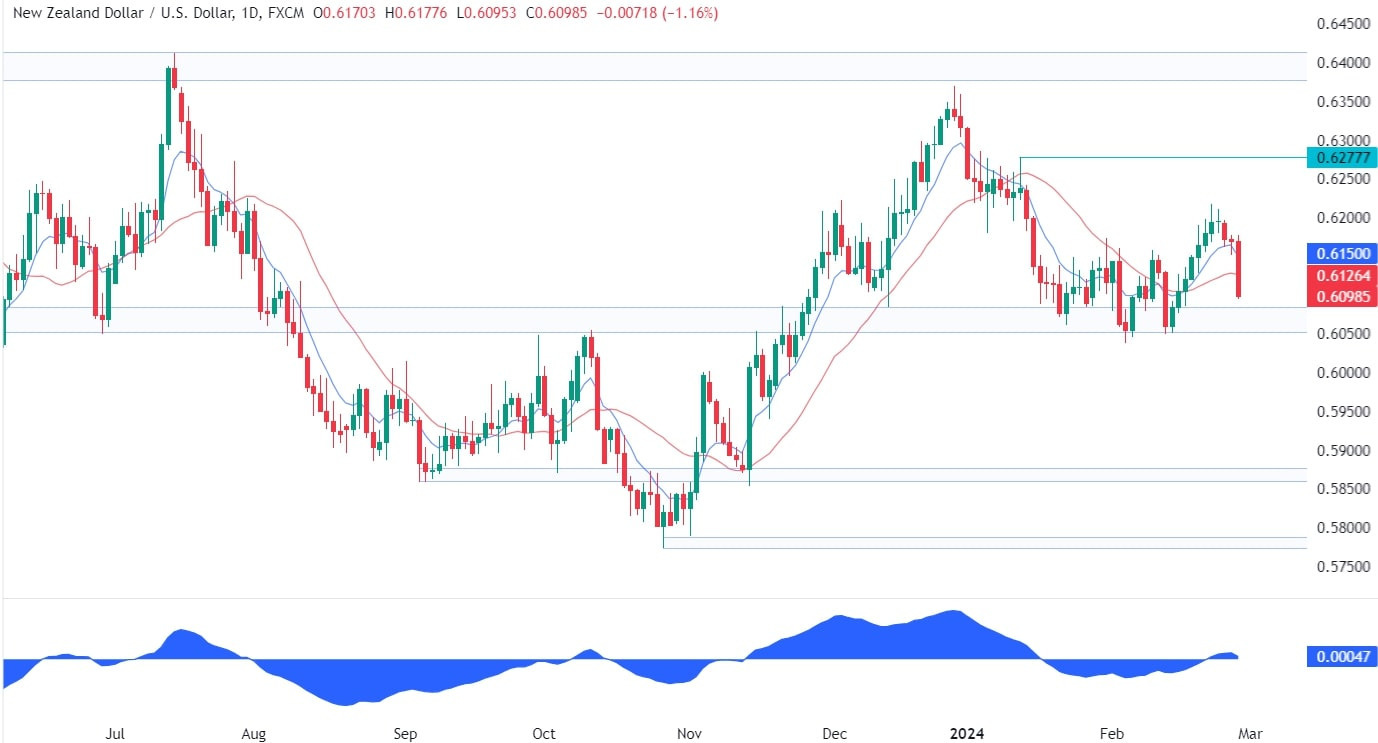
On the daily chart, we can see that NZDUSD has sold off today following the RBNZ rate decision where the central bank tweaked the statement dropping the tightening bias. There’s no support until the key 0.6050 zone, so we can expect the price to reach those levels. That’s where we can expect the buyers to step in with a defined risk below the support to position for a rally into the 0.6277 level. The sellers, on the other hand, will want to see the price breaking lower to increase the bearish bets into the 0.5875.
NZDUSD Technical Analysis – 4 hour Timeframe
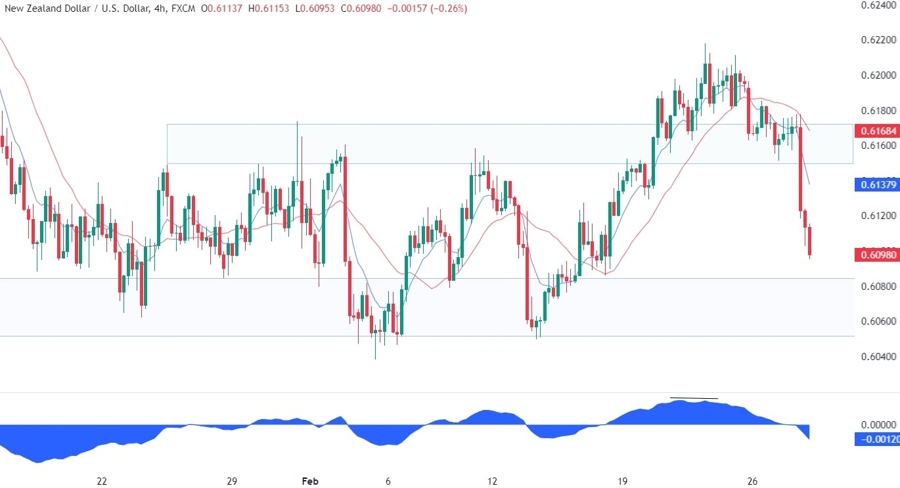
On the 4 hour chart, we can see that after breaking above the resistance zone, the price diverged with the MACD, which is generally a sign of weakening momentum often followed by pullbacks or reversals. The price indeed pulled back into the resistance turned support, but as soon as the price broke below the support following the RBNZ decision, the sellers piled in aggressively to target the key 0.6050 support zone.
NZDUSD Technical Analysis – 1 hour Timeframe
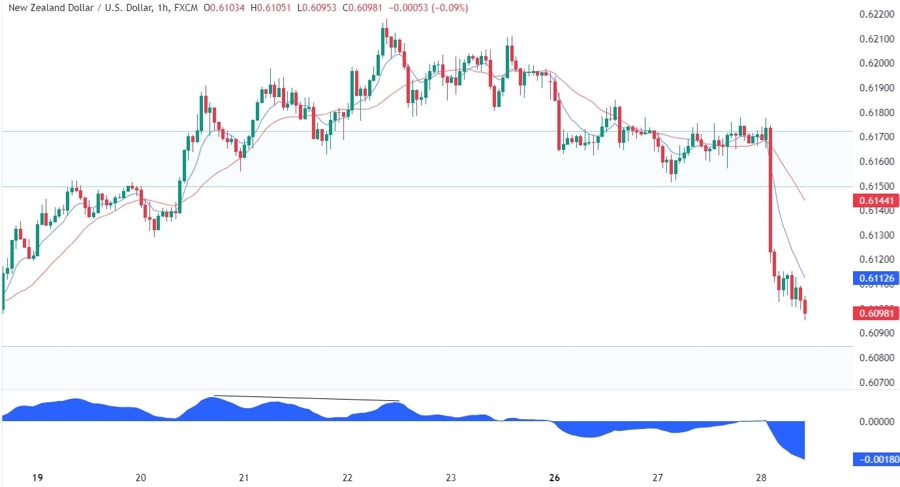
On the 1 hour chart, we can see that there’s not much to do here as the price stands right in the middle of the two key zones. The sellers can either wait for a pullback into the resistance to short the pair again or wait for the break below the support to increase the bearish bets into new lows. The buyers, on the other hand, will likely step in at the support to position for a rally into the resistance and increase the bullish bets into the 0.6277 level on a break above the resistance.
Upcoming Events
Tomorrow we will see the US PCE and the latest US Jobless Claims figures. On Friday, we conclude the week with the US ISM Manufacturing PMI.


