USD
- The Fed left interest rates unchanged as expected at the last meeting with a shift in the statement that indicated the end of the tightening cycle.
- The US GDP beat expectations by a big margin.
- The US PCE came mostly in line with expectations and the Core 3-month and 6-month annualised rates are now below the Fed’s 2% target.
- The US Job Openings surprised to the upside although the hiring and quit rates remain below pre-pandemic levels.
- The latest US PMIs beat expectations by a big margin for both the Manufacturing and Services measures.
- The US Retail Sales beat expectations across the board.
- The US Consumer Confidence report came in line with expectations but the labour market details improved considerably.
- The Fed members recently have been pushing back on the aggressive rate cuts expectations.
- The market now expects the first rate cut in May.
NZD
- The RBNZ kept its official cash rate unchanged at the last meeting stating that demand growth continues to ease and it’s expected to decline further with monetary conditions remaining restrictive.
- The New Zealand inflation data printed in line with expectations supporting the RBNZ’s patient stance.
- The latest labour market report showed a notable increase in the unemployment rate and a slowdown in wage growth which is something that will keep the RBNZ on the sidelines.
- The Manufacturing PMI fell further into contraction with the Services PMI following suit.
- The market expects the RBNZ to start cutting rates in Q2.
NZDUSD Technical Analysis – Daily Timeframe
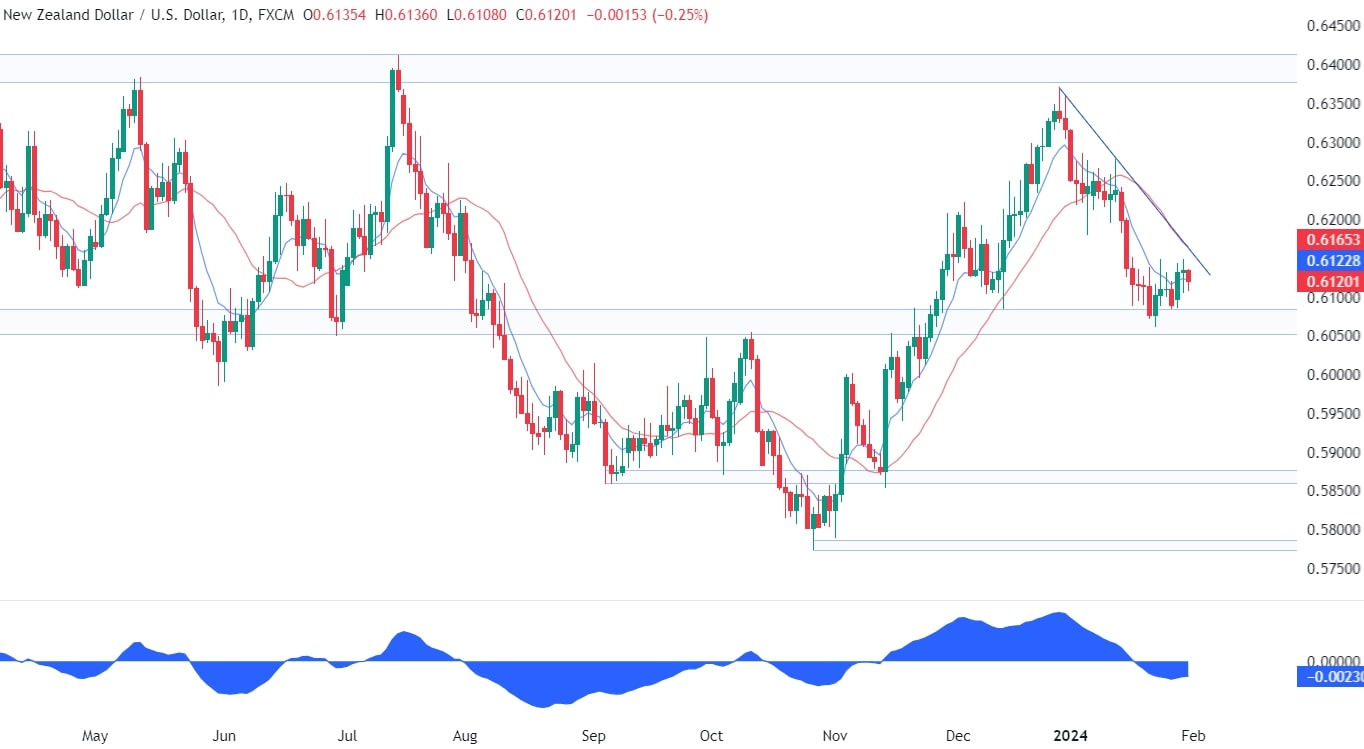
On the daily chart, we can see that NZDUSD bounced on the key support around the 0.6050 level and rallied into the 0.6150 level where it started to consolidate. We can see that we have a strong resistance around the 0.6150 level as there’s the confluence of the trendline and the red 21 moving average. This is where the sellers have been piling in to target a break below the key support and extend the drop. The buyers, on the other hand, will want to see the price breaking above the trendline to invalidate the bearish setup and position for a rally into the 0.64 resistance.
NZDUSD Technical Analysis – 4 hour Timeframe
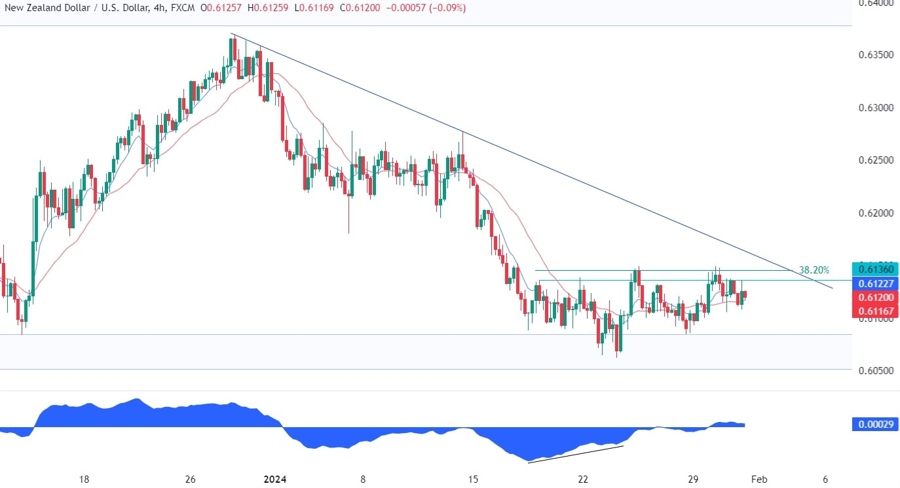
On the 4 hour chart, we can see that the price was diverging with the MACD as it was approaching the key support zone. This is generally a sign of weakening momentum often followed by pullbacks or reversals. In this case, we got the pullback into the most recent swing high where we had also the 38.2% Fibonacci retracement level for confluence. The pair started to consolidate as the buyers continued to push higher and the sellers defended the resistance.
NZDUSD Technical Analysis – 1 hour Timeframe
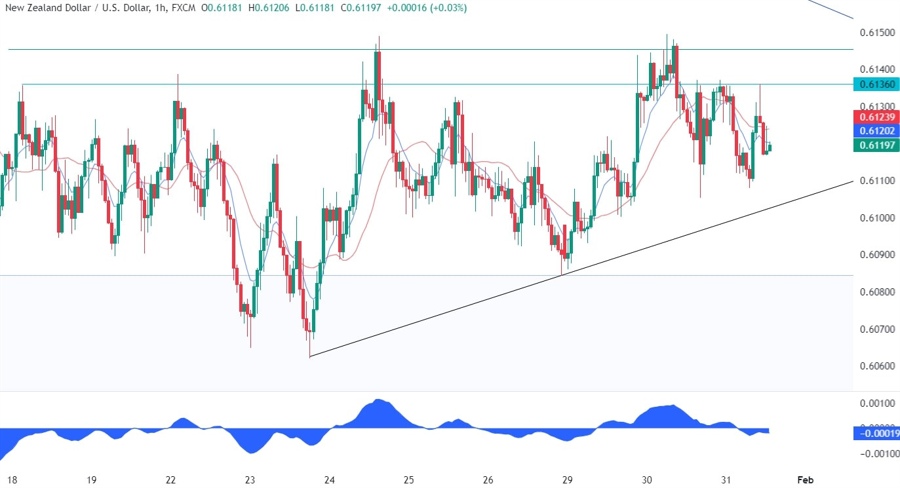
On the 1 hour chart, we can see more closely the recent price action and we can notice that we have another upward trendline formed by the lower highs. This formation looks like an ascending triangle. The price can break on either side but generally what follows next is a sustained move in the direction of the breakout. So, if the price were to break lower, we can expect the sellers to increase the bearish bets targeting a break below the key support. Conversely, if the price were to break above the resistance and the major trendline, then the bias would switch to bullish, and the buyers will start targeting the 0.64 resistance.
Upcoming Events
Today we have the US Employment Cost Index and the ADP data before the FOMC rate decision later in the day. Tomorrow, we will see the latest US Jobless Claims figures and the ISM Manufacturing PMI. On Friday, we conclude the week with the US NFP report.


