USD
- The Fed left interest rates unchanged as expected at the last meeting with a shift in the statement that indicated the end of the tightening cycle.
- The Summary of Economic Projections showed a downward revision to Growth and Core PCE in 2024 while the Unemployment Rate was left unchanged. Moreover, the Dot Plot was revised to show three rate cuts in 2024 compared to just two in the last projection.
- Fed Chair Powell didn't push back against the strong dovish pricing and even said that they are focused on not making the mistake of holding rates high for too long.
- The latest US CPI slightly beat expectations but analysts expect the Core PCE to print at 0.2% M/M again following the CPI data.
- The US PPI missed expectations across the board supporting the disinflationary impulse.
- The labour market continues to soften although Initial Claims keep on hovering around cycle lows while Continuing Claims are ranging at a higher level.
- The latest ISM Manufacturing PMI beat expectations, while the ISM Services PMI missed by a big margin.
- The Fed members recently have been pushing back on the aggressive rate cuts expectations.
- The market expects the Fed to start cutting rates in March.
NZD
- The RBNZ kept its official cash rate unchanged at the last meeting stating that demand growth continues to ease and it’s expected to decline further with monetary conditions remaining restrictive.
- The New Zealand inflation data missed expectations supporting the RBNZ’s stance.
- The latest labour market report showed a notable increase in the unemployment rate and a slowdown in wage growth which is something that will keep the RBNZ on the sidelines.
- The Manufacturing PMI improved although it remains in contractionary territory. The Services PMI, on the other hand, jumped back into expansion.
- The market expects the RBNZ to start cutting rates in Q2.
NZDUSD Technical Analysis – Daily Timeframe
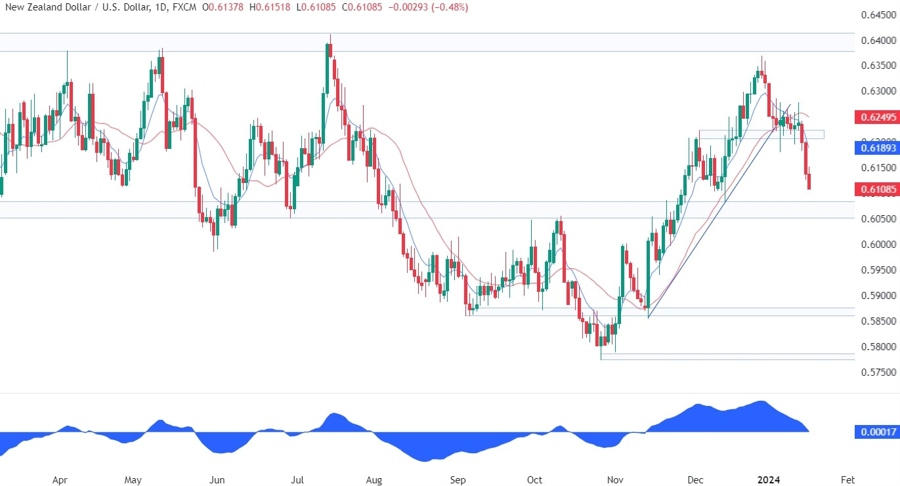
On the daily chart, we can see that NZDUSD broke the key support zone around the 0.62 handle and extended the decline as the market started to reprice the aggressive rate cuts expectations. The price is now approaching the support around the 0.6070 level which is where we can expect the buyers to step in with a defined risk below the level to position for a rally back into the 0.64 resistance.
NZDUSD Technical Analysis – 4 hour Timeframe
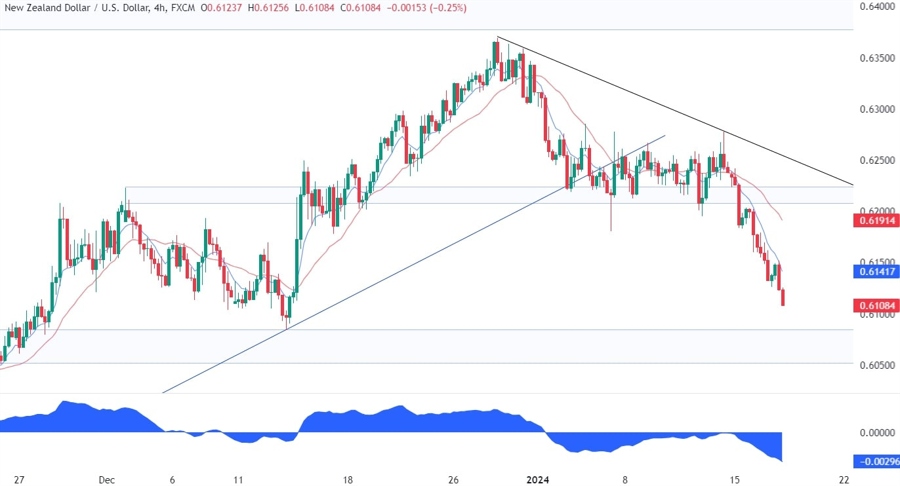
On the 4 hour chart, we can see that from a risk management perspective, the sellers will have a much better risk to reward setup around the downward trendline where we can also find the previous support now turned resistance for confluence. At the moment though, it’s hard to envision such a rally without a series of weak US data, so that’s what the market participants will closely look at.
NZDUSD Technical Analysis – 1 hour Timeframe
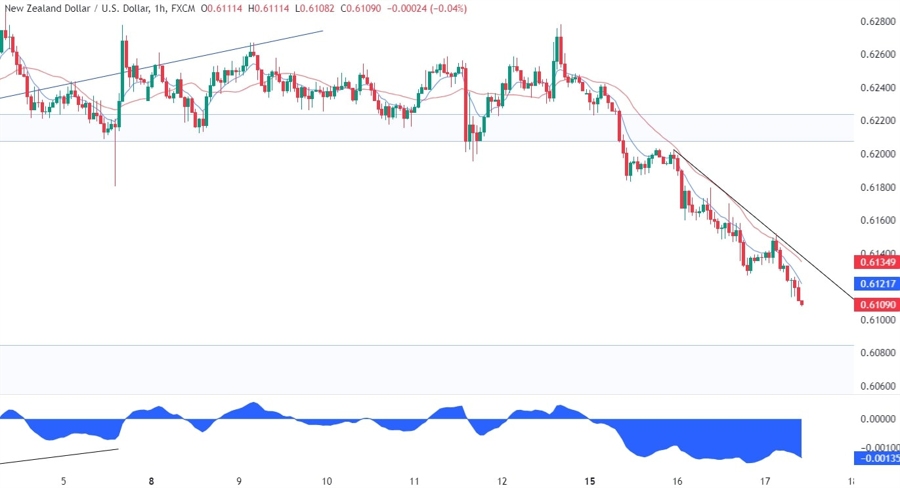
On the 1 hour chart, we can see that we have another minor trendline that is defining the current downtrend. The sellers will likely lean on the trendline as they will also find the confluence with the red 21 moving average to keep positioning for lower prices and a break below the 0.6070 support zone. The buyers, on the other hand, will want to see the price breaking higher to start targeting the major trendline around the 0.6220 level.
Upcoming Events
Today, we will get the US Retail Sales and Industrial Production data, while tomorrow we will see the New Zealand Manufacturing PMI and the latest US Jobless Claims figures. On Friday, we conclude the week with the University of Michigan Consumer Sentiment survey.


