USD
- The Fed left interest rates unchanged as expected with basically no change to the statement.
- Fed Chair Powell stressed once again that they are proceeding carefully as the full effects of policy tightening have yet to be felt.
- The recent US Core PCE came in line with expectations.
- The labour market is starting to show some weakness as Continuing Claims are now rising at a fast pace and the recent NFP report missed across the board.
- The US Consumer Confidence and University of Michigan Consumer Sentiment continue to fall.
- The recent US ISM Manufacturing PMI missed expectations by a big margin, followed by a disappointing ISM Services PMI, although the latter remained in expansion.
- The recent Fedspeak has been leaning on the hawkish side, but the inflation and labour market reports before the next meeting will decide whether they will indeed hike or not.
- The market doesn’t expect the Fed to hike anymore.
NZD
- The RBNZ kept its official cash rate unchanged while stating that demand growth continues to ease and it’s expected to decline further with monetary conditions remaining restrictive.
- The New Zealand recent inflation data missed expectations supporting the RBNZ’s stance.
- The latest labour market report showed a notable increase in the unemployment rate and a slowdown in wage growth which is something that is likely to keep the RBNZ on the sidelines.
- The Manufacturing PMI fell further into contraction followed by the Services PMI which fell back into contraction.
- The market doesn’t expect the RBNZ to hike anymore.
NZDUSD Technical Analysis – Daily Timeframe
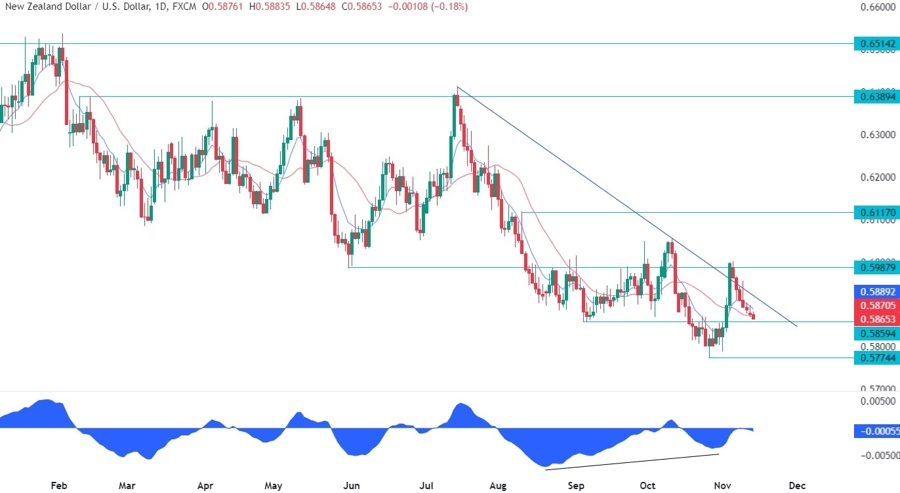
On the daily chart, we can see that NZDUSD rejected the resistance around the 0.60 handle and erased almost all the gains seen after the FOMC and NFP report. The pair is now at a key support level where the buyers are likely to step in to position for a rally back into the resistance. The sellers, on the other hand, will want to see the price breaking lower to increase the bearish bets into the 0.5775 low.
NZDUSD Technical Analysis – 4 hour Timeframe
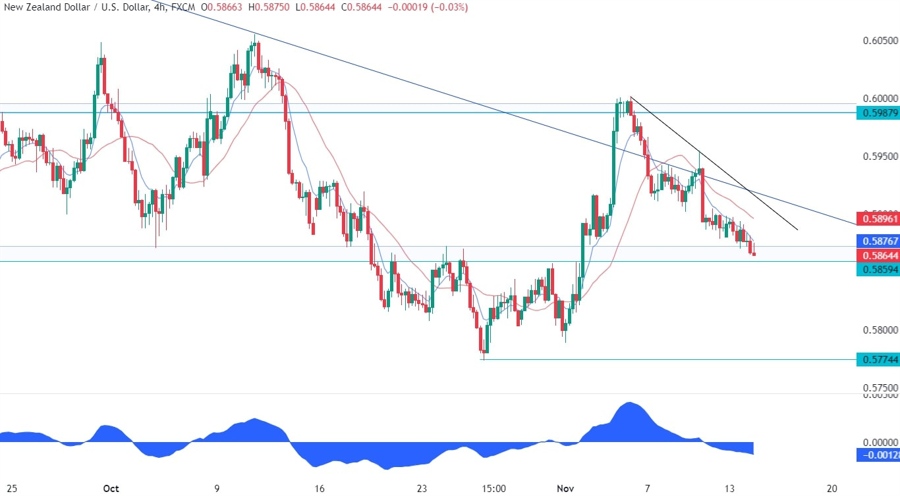
On the 4 hour chart, we can see that from a risk management perspective, the sellers would be better off waiting for a pullback into the trendline where they will also have the red 21 moving average for confluence. The buyers, on the other hand, should start to pile in around this support with a defined risk below it to target the trendline first and eventually a breakout.
NZDUSD Technical Analysis – 1 hour Timeframe
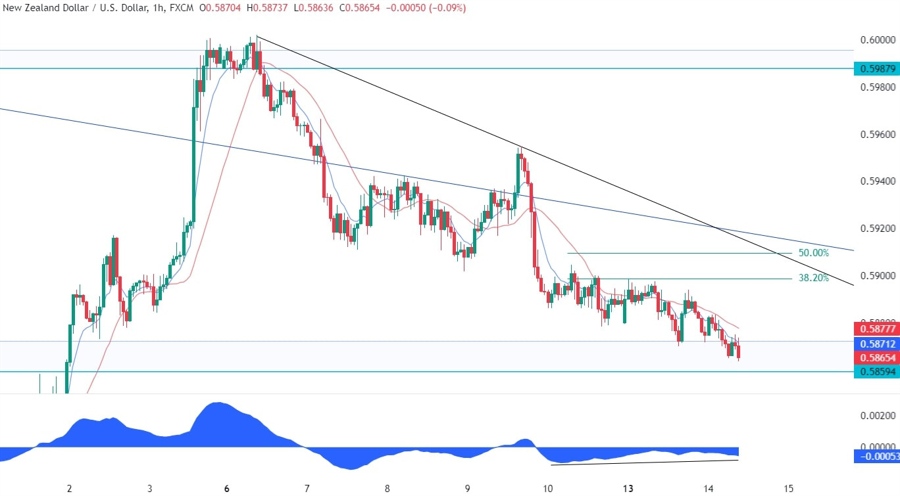
On the 1 hour chart, we can see that the price is diverging with the MACD right at the key support zone. This is generally a sign of weakening momentum often followed by pullbacks or reversals. In this case, it might be another confirmation of an impending pullback into the trendline. If the price breaks above it, the reversal would be confirmed, and the bearish setup would be invalidated.
Upcoming Events
This week we have some top tier economic releases. We begin today with the US CPI report which might be one of the most important events of the week. Tomorrow, we have the US Retail Sales and PPI data, while on Thursday we conclude with the latest US Jobless Claims figures.


