US
- The Fed left interest rates unchanged as expected with basically no change to the statement.
- Fed Chair Powell stressed once again that they are proceeding carefully as the full effects of policy tightening have yet to be felt.
- The US Core PCE last week came in line with expectations.
- The labour market remains pretty resilient but we are starting to see some weakness as Jobless Claims missed expectations once again this week with Continuing Claims now rising at a fast pace.
- The US Consumer Confidence fell for the third consecutive month although the data beat expectations.
- The US ISM Manufacturing PMI this week missed expectations by a big margin.
- The market doesn’t expect the Fed to hike anymore.
New Zealand
- The RBNZ kept its official cash rate unchanged while stating that demand growth continues to ease and it’s expected to decline further with monetary conditions remaining restrictive.
- The New Zealand recent inflation data missed expectations supporting the RBNZ’s stance.
- The latest labour market report showed a notable increase in the unemployment rate and a slowdown in wage growth which is something that the central banks are watching carefully.
- The Manufacturing PMI continues to slide further into contraction, but the Services PMI jumped back into expansion.
- The market doesn’t expect the RBNZ to hike anymore.
NZDUSD Technical Analysis – Daily Timeframe
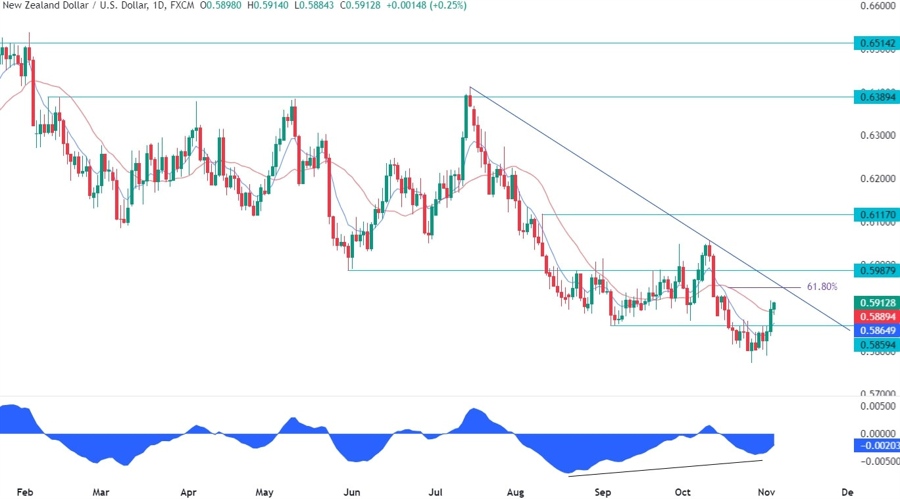
On the daily chart, we can see that after breaking above the key resistance around the 0.5860 level, the NZDUSD pair kept on rallying strongly and it now eyes the trendline around the 0.5950 level where we can also find the 61.8% Fibonacci retracement level for confluence. That’s where we can expect the sellers to step in more aggressively with a defined risk above the trendline to position for a drop into new lows. The buyers, on the other hand, will want to see the price breaking higher to increase the bullish bets and start targeting the 0.61 handle.
NZDUSD Technical Analysis – 4 hour Timeframe
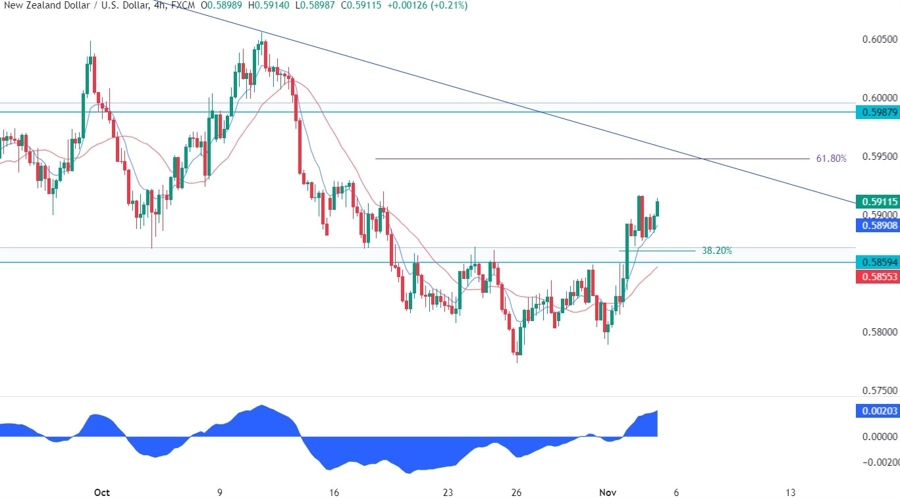
On the 4 hour chart, we can see that from a risk management perspective, the buyers will have a better risk to reward setup around the broken resistance turned support where they will also find the confluence with the 38.2% Fibonacci retracement level and the red 21 moving average. The sellers, on the other hand, will want to see the price breaking below the support to invalidate the bullish setup and position for a drop into new lows.
NZDUSD Technical Analysis – 1 hour Timeframe
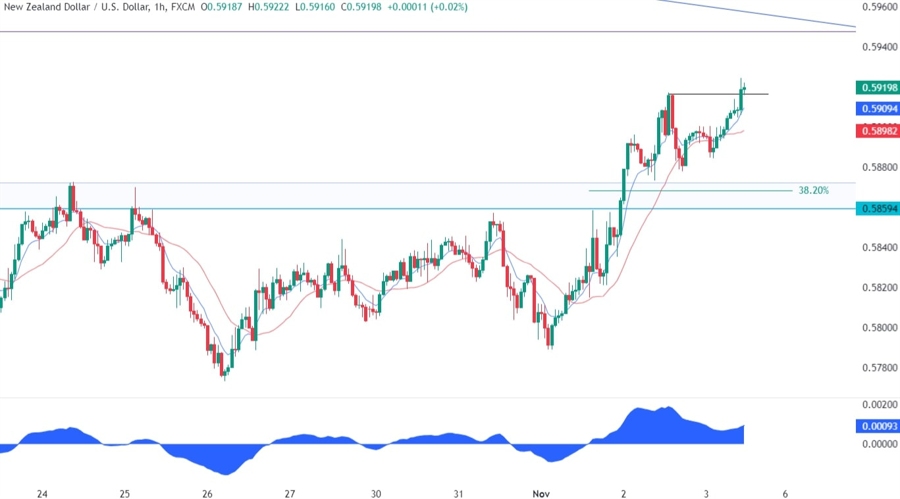
On the 1 hour chart, we can see more closely the bullish setup around the 0.5870 level. The price is now breaking the recent high and we can even expect more buyers coming into the market at these levels, but the risk to reward is much worse, especially trading into the NFP report.
Upcoming Events
Today, we conclude the week with the US NFP report and the ISM Services PMI. If the data misses expectations we are likely to see more downside for the USD in the short-term.


