The miss in the US CPI report led to a big and fast depreciation in the USD across the board as the market started to be sure about the Fed ending its tightening cycle very soon. In fact, the hawkish expectations for future hikes got priced out although the hike in July remained a done deal. This is because the labour market remains tight, and the Fed speakers didn’t hint to any skip or pause at the July meeting after the CPI release. The RBNZ, on the other hand, kept its official cash rate unchanged while stating that it will remain at the restrictive level for the foreseeable future to ensure that inflation comes down back to target.
NZDUSD Technical Analysis – Daily Timeframe
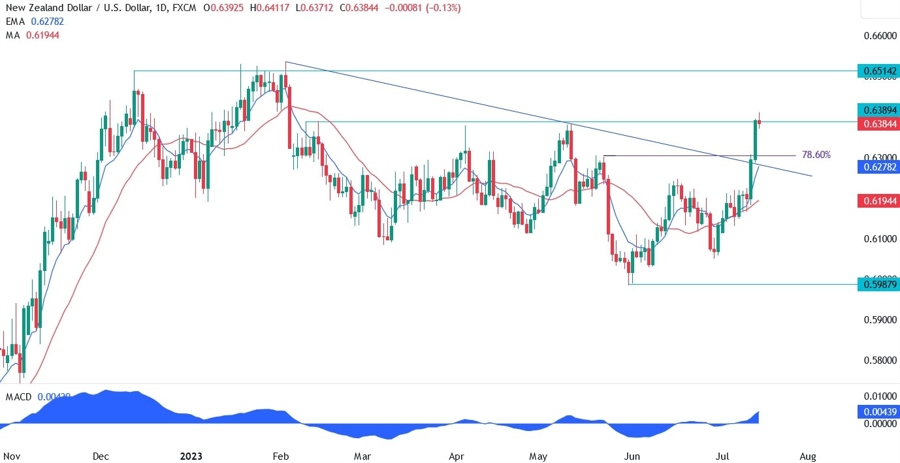
On the daily chart, we can see that the miss in the US CPI caused the NZDUSD to rally strongly into the 0.389 key resistance in just 2 days. The price broke out of the 0.63 handle, the trendline and the 78.6% Fibonacci retracement level very easily as the fundamental catalyst was too strong and the sellers couldn’t do anything. The price is now overstretched from the blue 8 moving average, and we can generally see some consolidation or a pullback into the moving average before a resumption in the trend.
NZDUSD Technical Analysis – 4 hour Timeframe
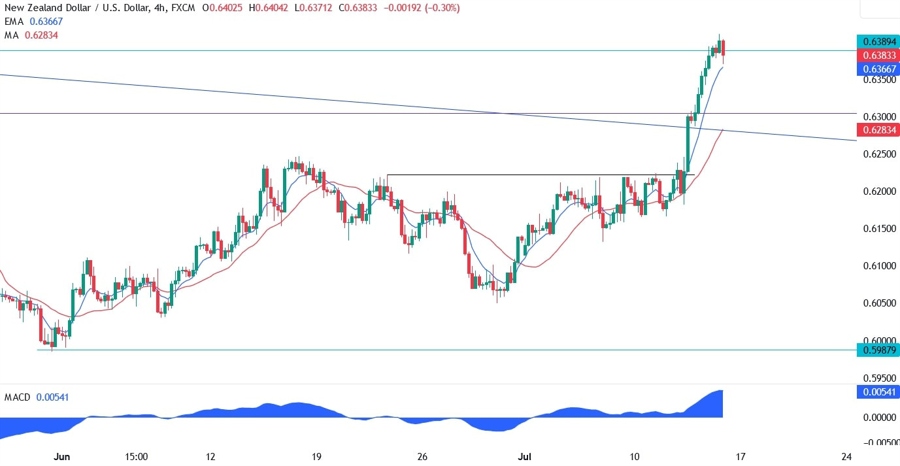
On the 4 hour chart, we can see that the price is reacting to the 0.6389 resistance now. The sellers should step in here with a defined risk above the resistance and target the pullback into the 0.63 handle. The buyers, on the other hand, should wait near the 0.63 to pile in with a better risk to reward setup and target a break above the 0.6389 resistance and eventually the 0.65 handle.
NZDUSD Technical Analysis – 1 hour Timeframe
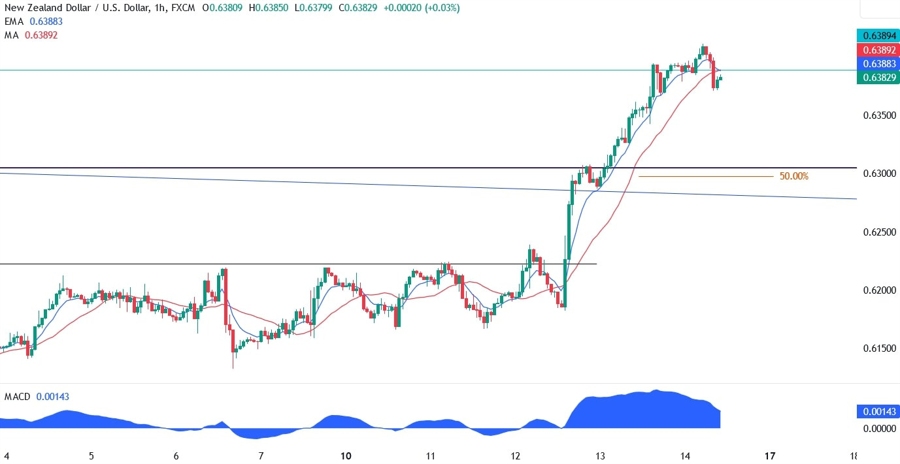
On the 1 hour chart, we can see that the 0.63 support has also confluence with the 50% Fibonacci retracement level and the broken trendline. From a risk management perspective that would be a better level where to buy from for the buyers. The sellers, on the other hand, are likely to extend the selloff if the price break below the 0.63 support zone.
Upcoming Events
Today the only notable event on the calendar is the University of Michigan Consumer Sentiment report. The data is unlikely to be too much market moving unless we see big deviations from the expected numbers, but the market is likely to be more focused on the inflation expectations figures.


