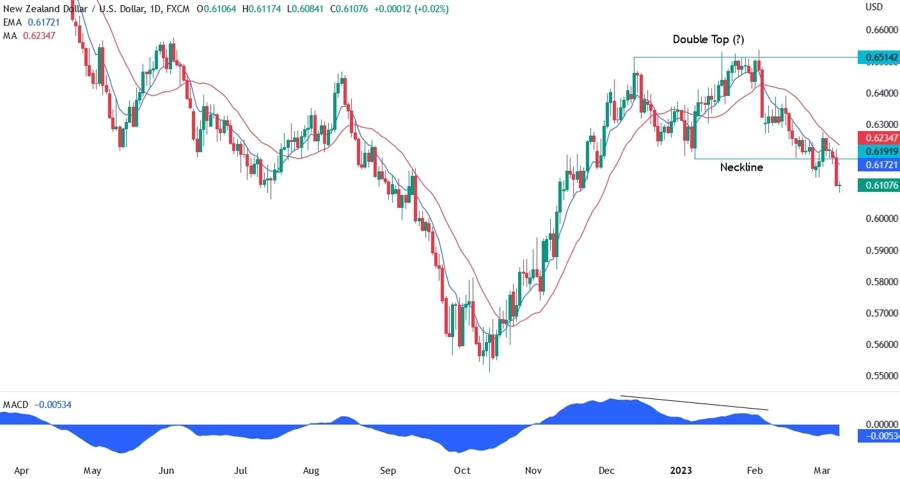
On the daily chart below, we can see the big double top with the high at 0.6514 and the neckline at 0.6191. We can also see that the two tops of the pattern are diverging with the MACD.
This generally makes a pattern more reliable. The first breakout of the neckline at the end of February failed, but the sellers leant on the red long period moving average and piled in again to try another more decisive breakout. We got that yesterday.
The catalyst was the Fed Chair Powell testimony where he opened the door for a more aggressive 50bps hike and signalled that a higher terminal rate was needed. The USD rallied hard immediately across the board. The sellers are comfortably in control and probably only a miss in the NFP report can cause some USD weakness.
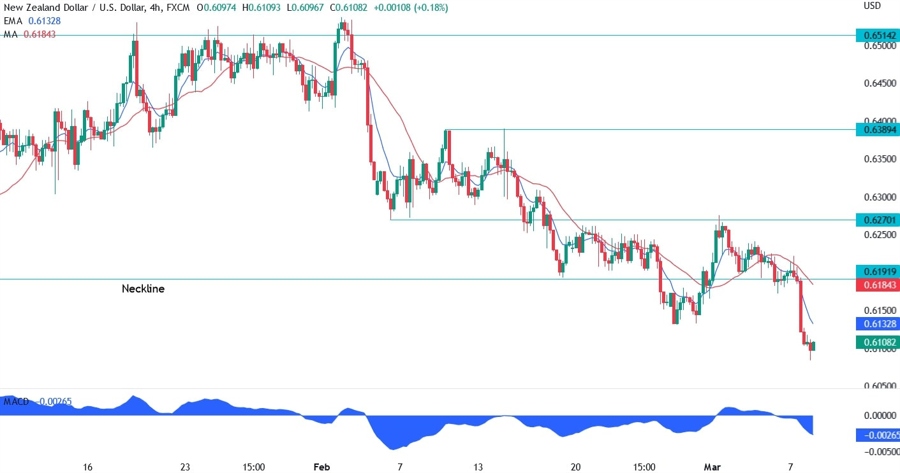
On the 4 hour chart below, we can see that after the first failed breakout the price rallied towards the 0.6270 resistance where the buyers found strong sellers as the ISM Manufacturing PMI showed prices paid rising and, given the market sensitivity to inflation, buyers folded as the market started to price a more hawkish interest rates path.
What we got later is probably just positioning into a possible hawkish Powell followed by the breakout as Powell indeed sounded very hawkish. The price is now a bit overextended as we can see by the distance from the blue short period moving average. Generally, we can see some consolidation or a pullback before another push in the original trend.
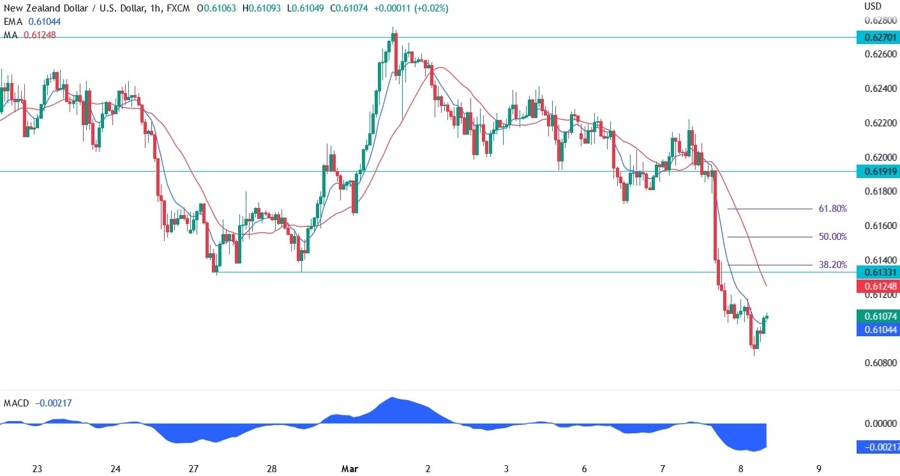
On the 1 hour chart below, we can see that in case we get a pullback, the nearest and most probable resistance for the buyers will be the 0.6133 level where we have also the confluence with the 38.2% Fibonacci retracement level and the red long period moving average. That’s the area where we are most likely going to see sellers piling in for another push lower targeting new lower lows.