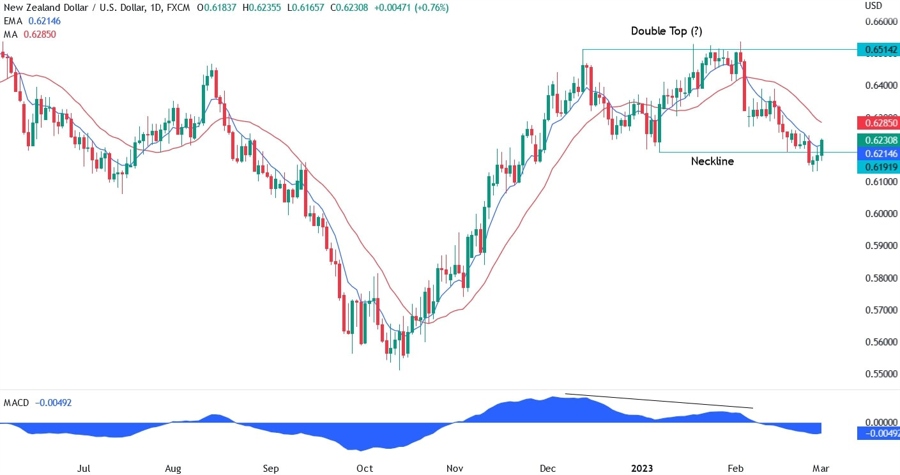
On the daily chart below, we can see that the price eventually managed to breach the neckline at 0.6191 of the possible double top at 0.6514. Unfortunately for the sellers, the strength was not enough to keep the momentum going and the buyers regained control.
Generally, divergent double tops, as depicted by the MACD, are more reliable, so this may be just a pullback rather than a full reversal. The red long period moving average will act as resistance for the price where the buyers will also find a previous swing level.
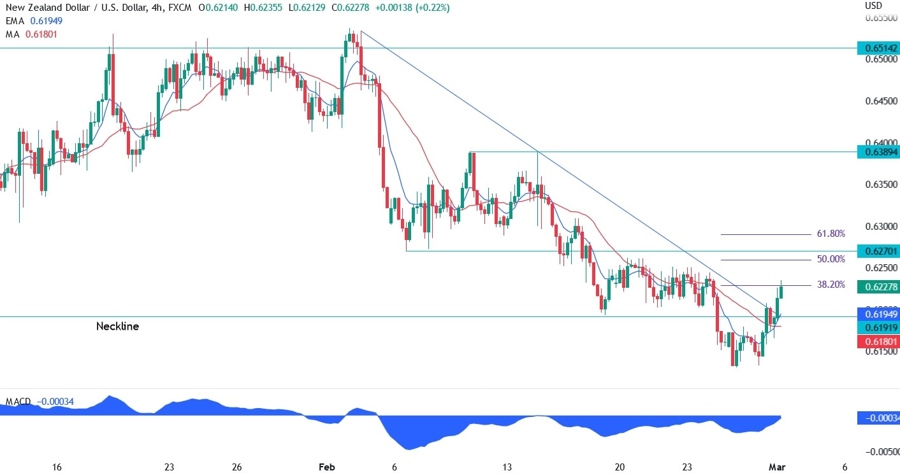
On the 4 hour chart below, we can see that the buyers managed to break the trendline and now may have enough momentum to target the swing resistance level at 0.6270. There will also be the 50% Fibonacci retracement level there for further confluence and the daily red long period moving average.
If the buyers manage to break that level as well, then we may see an extension to the next resistance at 0.6390. The 0.6270 level will be a good level to lean on or to define risk for the sellers today if the ISM Manufacturing PMI beats expectations because “good news is bad news” now.
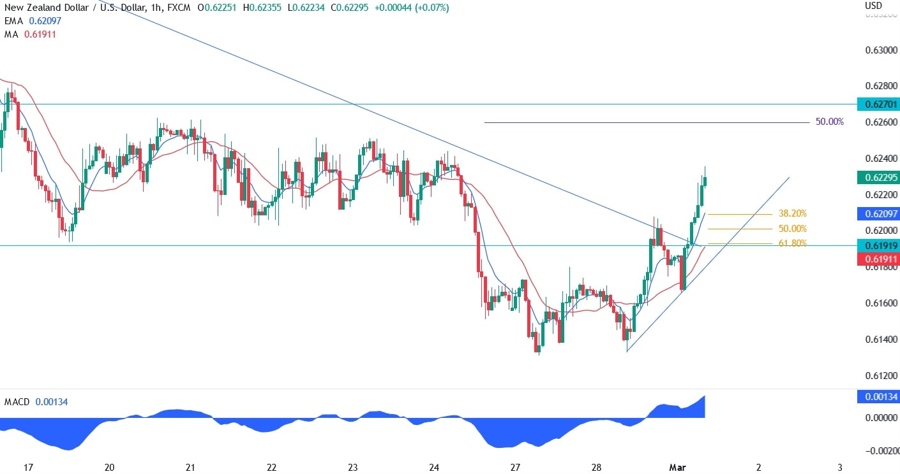
On the 1 hour chart below, we can see the target for the buyers at 0.6270, but there’s also a possible support level in case we see a pullback before another push upwards. The price may retrace back to the minor upward trendline where we can also find the Fibonacci retracement levels and the moving averages.
That will be a good spot for the buyers as the last line of defence. For the sellers, a break below the trendline would open the doors for a bigger fall as that may be the second and possibly the successful breakout of the neckline.