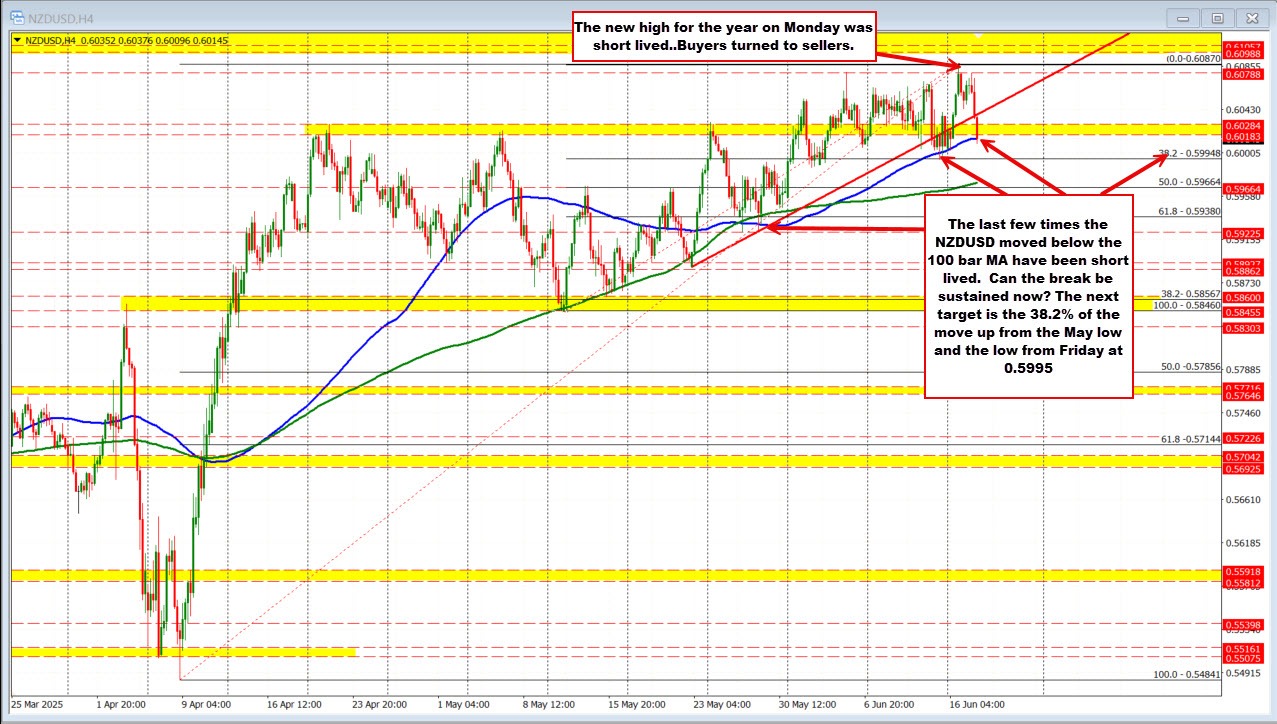
The NZDUSD reached a new high for the year on Monday, but the move quickly lost momentum as buyers turned into sellers, making the breakout short-lived. The pair has since fallen below the 100-bar moving average on the 4-hour chart—a level that has previously provided reliable support during corrective pullbacks.
Notably, the last few breaks below the 100-bar MA were brief and failed to gain downside traction. The question now is whether this latest move can sustain itself. If so, sellers will look toward the 38.2% retracement of the May rally at 0.59948, which also aligns closely with the Friday low at 0.5994—a key target to reinforce bearish control.
A firm break below that zone would increase downside momentum, exposing the 200-bar MA at 0.5971 and the 50% retracement level at 0.5966 as the next critical support levels.
On the topside, near-term resistance is now seen between 0.6018 and 0.6029. As long as the price stays below that range, the bearish bias remains in play.


