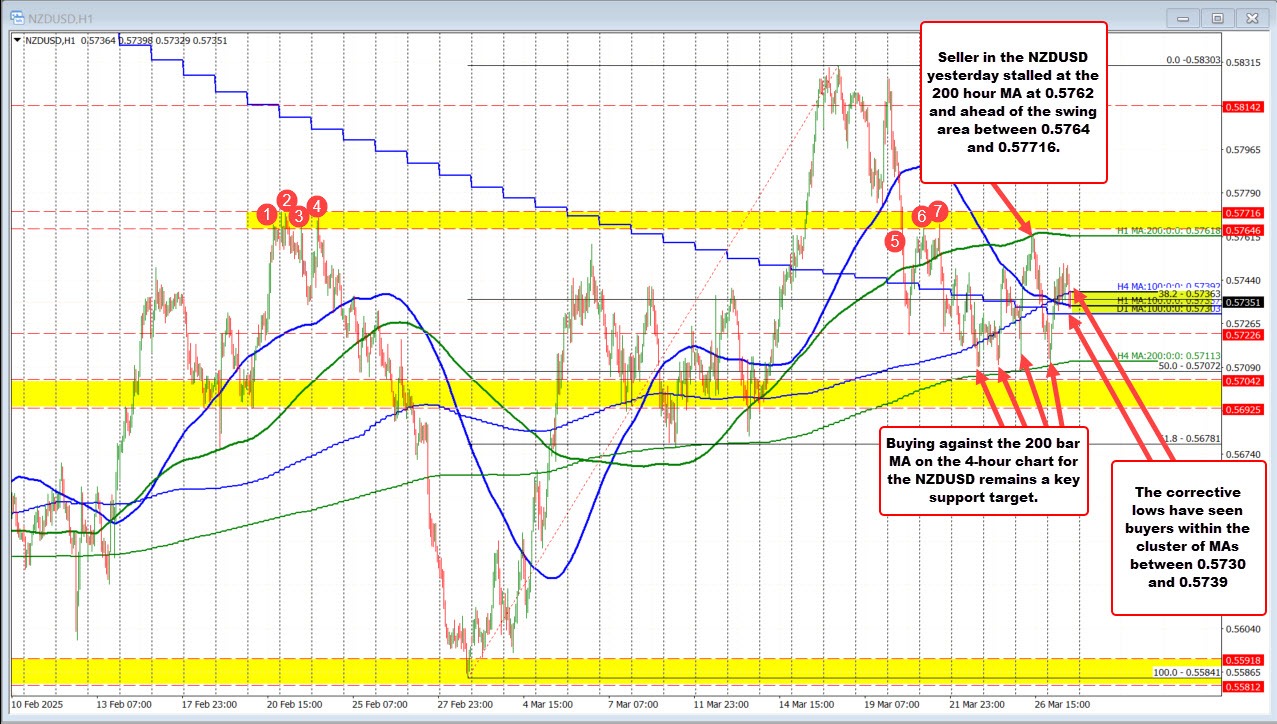
NZDUSD is currently trapped in a tight range, ping-ponging between key moving averages as traders await a decisive breakout. The 200 bar MA on the 4-hour chart at 0.57113 is acting as support, while the 200 hour MA at 0.57618 caps the upside.
In between lies a confluence of technical levels:
100 bar MA on the 4-hour chart
100 hour MA at 0.57335
100 day MA at 0.57303
This cluster between 0.5730 and 0.5739 has seen dip buyers stepping in recently, providing near-term support. A break above 0.5762 (200 hour MA) would shift the bias more bullishly, potentially opening the door toward the swing area between 0.5764 and 0.5772. On the flip side, a move below 0.5711 (200 bar MA on the 4-hour) would tilt the bias more bearish, targeting the broader support near 0.5674 and lower.
Key technical levels:
Resistance: 0.57618 (200 hour MA), 0.57646–0.57716 (swing zone)
Support: 0.57303–0.57335 (MA cluster), 0.57113 (200 bar MA on 4H), 0.56742
Cluster of 100 bar MA between 0.5730 and 0.5739. Break above = bullish. Break below is more bearish.
The market is coiled and waiting—momentum is likely to follow whichever side gives way first.
4o


