Nvidia shares are taking off. They are currently up around 3.9% at $193.80 after beating earnings and guiding higher than expectations going forward.
Technically speaking, the move to the upside as increase the bullish bias:
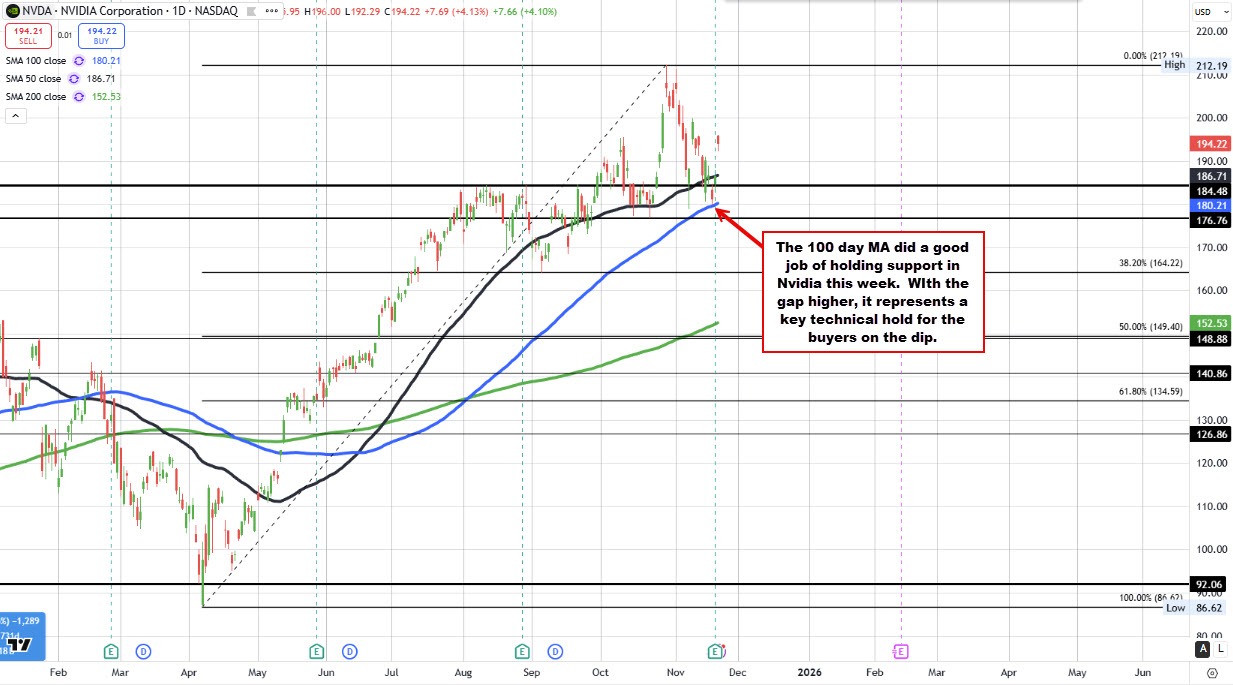
- Looking at the daily chart, the price low this week stalled right near its 100 day moving average (blue line in the chart below). In hindsight, that represent a good signal from a technical perspective .
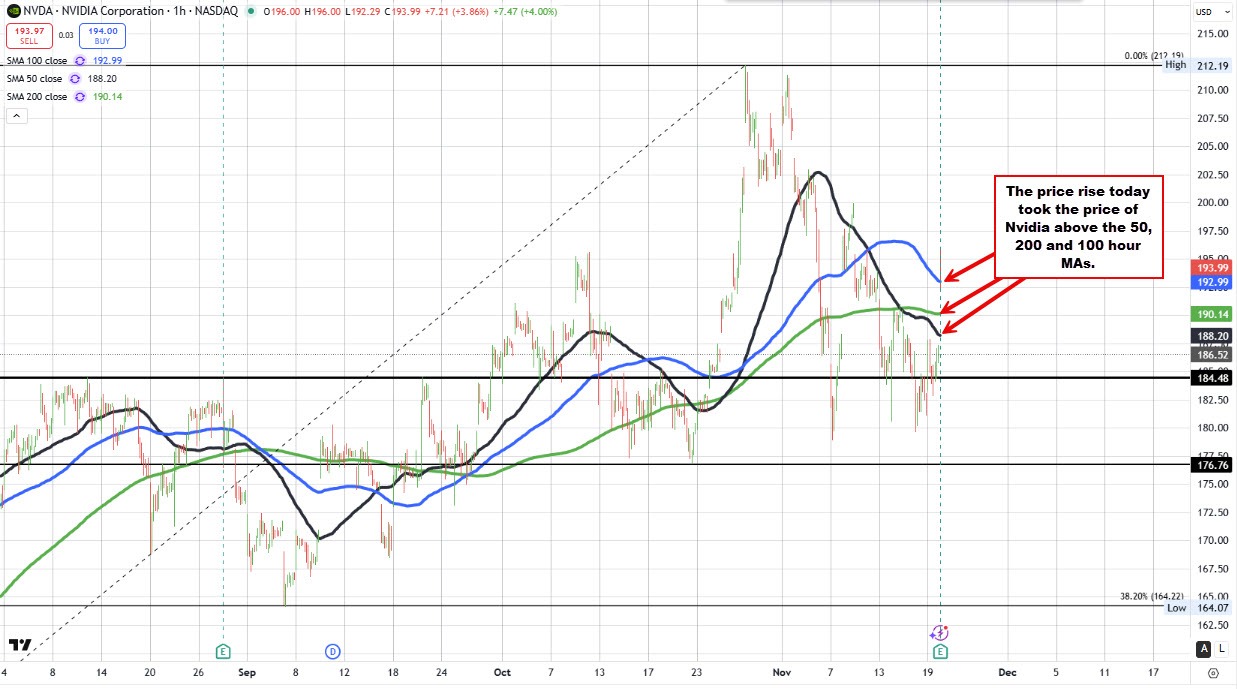
- Looking at the hourly chart below, the gap higher today, has taken the price above the 50 hour moving average at $188.20, the 200 hour moving average at $190.14, and the 100 hour moving average at $193.00. If the price can remain above the 100 hour moving average (blue line on the chart below) the buyers remain in firm control. If the price were to move below the 100 hour moving out of could see some further corrective action toward the 200 hour moving average.
In the video above, I talk about the technicals and explain the dynamics of the bias, the risk, and the targets given the lift off today.
