Fundamental Overview
The Nasdaq continues to maintain a positive outlook although it came under some pressure recently as the DeepSeek news weighed on the tech heavy index.
The market has been making new highs ever since the last US inflation data as it marked the top in the repricing of rate cuts expectations and inflation fears.
The Fed on Wednesday kept interest rates unchanged as widely expected and Fed Chair Powell maintained a neutral stance as they are waiting for more inflation progress and more clarity on Trump’s policies before cutting again.
The market is now back in expecting two rate cuts by the end of the year with the first one seen in June. The risks ahead lie around inflation as the market will want to see more progress to avoid some tightening in financial conditions.
There are also risks to growth, especially if Trump’s tariffs lead to trade wars. Right now, it seems like he just threatens countries with tariffs to get better deals, so the market generally fades the news.
Nasdaq Technical Analysis – Daily Timeframe
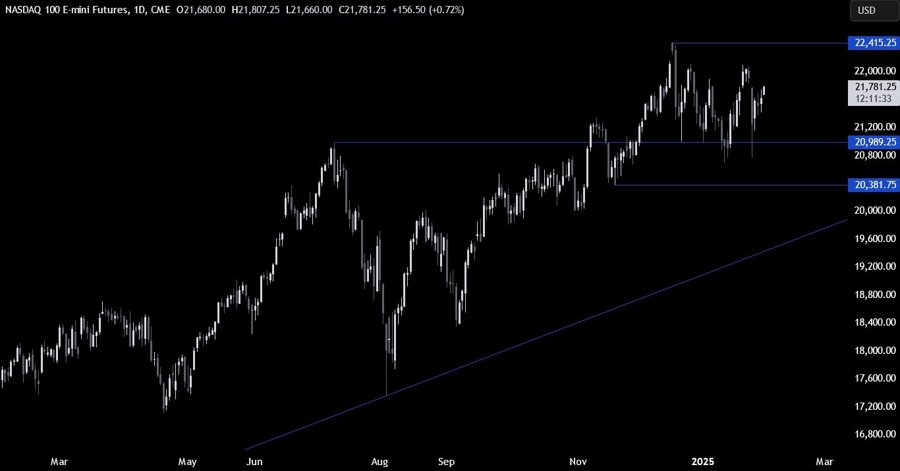
On the daily chart, we can see that the Nasdaq sold off all the way back to the key 21000 support following the DeepSeek news. The dip-buyers piled in around the support to position for a new all-time high. Overall, we continue to trade in a big range, so the sellers will need the price to break below the support to gain more conviction or step in around the resistance for better risk to reward setups.
Nasdaq Technical Analysis – 4 hour Timeframe
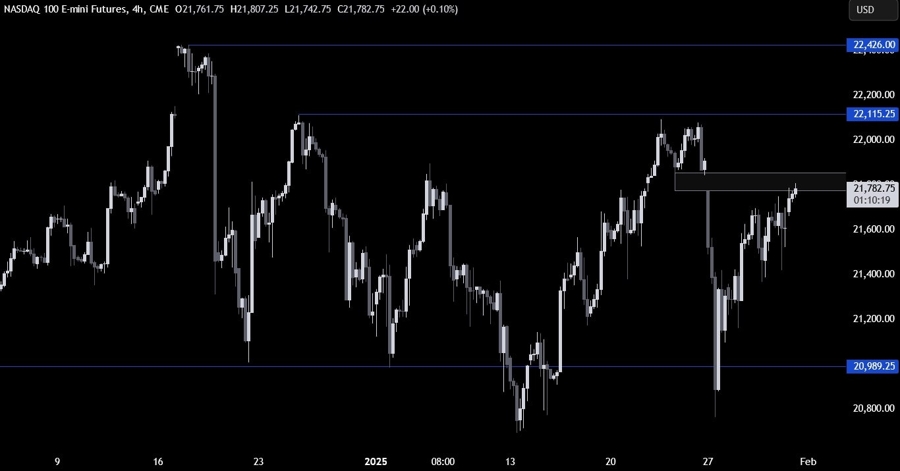
On the 4 hour chart, we can see that the price is testing the “DeepSeek gap” now. This is where we can expect the sellers to step in with a defined risk above the zone to position for a drop back into the support. The buyers, on the other hand, will want to see the price breaking higher to increase the bullish bets into a new all-time high.
Nasdaq Technical Analysis – 1 hour Timeframe
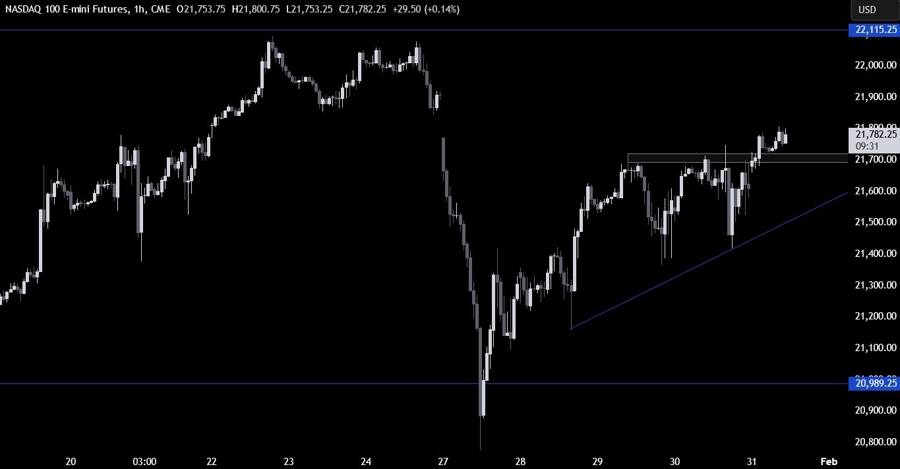
On the 1 hour chart, there’s not much we can add here although we have a minor support zone around the 21700 level where the buyers might lean onto to keep pushing into new highs. The sellers, on the other hand, will look for a break lower to increase the bearish bets into new lows. The red lines define the average daily range for today.
Upcoming Catalysts
Today we conclude the week with the US PCE and the US Employment Cost Index.

