NASDAQ Technical Analysis for Today: Bulls Regain Control After the Washout, but Key Levels Matter
The NASDAQ has gone through a sharp and unsettling pullback yesterday, raising questions among traders and investors about whether the broader uptrend is losing steam, and maybe the new Trump tarriff on chips is going to startle the market. Even the USDJPY fell back below the 2025 high following intense verbal intervention, so what's next?
Based on a combination of price structure, value behavior, and order flow intel, the picture today is more constructive than it was yesterday, though not without important conditions.
The key takeaway is this: the market has likely completed a short-term washout, and the medium-term outlook has improved, but bullish continuation depends on how price behaves around a small set of critical levels.
Nasdaq Futures Yesterday and Today. From Washout to Stabilization, What Changed?
Earlier in the week, selling pressure intensified and the NASDAQ moved lower in a way that justified a bearish medium-term bias. That downside move did its job. Heavy volume appeared during the decline, weak hands were forced out, and price explored lower value areas.
What followed was more important than the selloff itself.
Instead of cascading lower, price stabilized, value stopped migrating down, and buyers began to step back in. On higher timeframes, the market started to accept prices above prior value, which is often a sign that the downside auction has run its course.
This shift is why the medium-term bias has turned more bullish than bearish again, even though short-term pullbacks and pauses remain possible.
The Bullish Case is In Tact Now at Nasdaq and What Needs to Hold
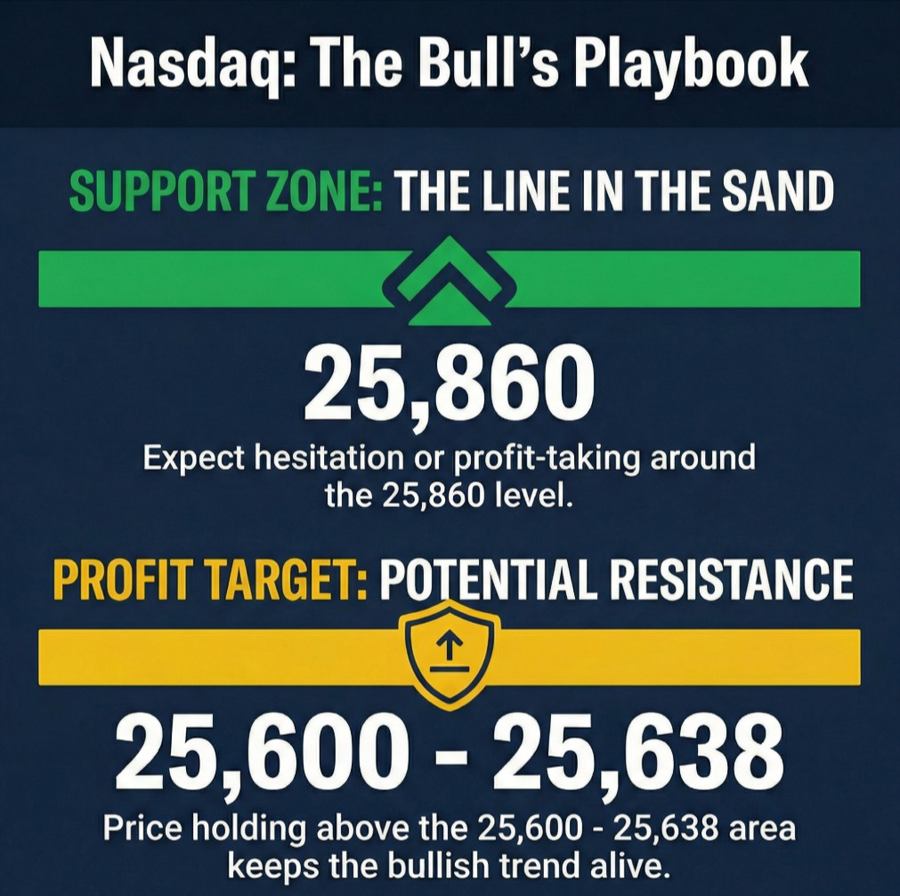
For traders and investors leaning bullish, the most important zone to monitor is 25,600.
This level matters for several reasons:
It aligns with the current point of control.
It matches yesterday’s VWAP.
It overlaps with prior points of control from earlier sessions.
In other words, 25,600 is a line in the sand.
If price pulls back and buyers defend this area, the bullish reversal thesis remains intact.
Just above that, 25,638 also deserves attention. This level marks yesterday’s value area high and sits very close to today’s developing VWAP. Bulls ideally want to see price remain above this zone, or quickly reclaim it if tested.
As long as price holds above the 25,600 to 25,638 area, pullbacks are more likely to be rotational and corrective, not trend-breaking.
Where Nasdaq Bulls May Take Profits
On the upside, traders should be realistic. Even in bullish environments, markets do not move in a straight line.
One area that stands out is around 25,860. This zone sits close to:
The value area low from two days ago.
The VWAP from roughly three sessions back.
These overlapping references make it a natural place where partial profit-taking could appear, especially for short-term traders. Seeing hesitation or consolidation there would not invalidate the bullish case. It would be a normal part of a healthy advance.
The Bearish Scenario for Nasdaq Today (Less Likely, Despite Yesterday): What Would Change the View
Balanced analysis requires clarity on invalidation.
If price fails to hold above 25,600, the bullish premise weakens meaningfully. In that case:
The market may revisit yesterday’s low.
A deeper rotation toward the 25,350 area becomes plausible.
Such a move would suggest that buyers are not yet ready to build value higher, and the market would likely need more time to repair before another sustained attempt upward.
How Order Flow Intel Frames the Current Bias for Nasdaq Today
From an order flow perspective, the message today is more constructive than it was yesterday.
Heavy selling volume earlier in the week appears to have exhausted itself.
Recent price advances show acceptance rather than immediate rejection.
On medium timeframes, buyers have regained control, even though short-term timing has at times been stretched.
This does not mean a promise of higher prices. Markets can always surprise. It does mean that, at this stage, order flow intel favors a bullish recovery scenario, provided key support zones are respected.
Practical Guidance for Nasdaq Traders and Investors
Bullish bias remains valid as long as 25,600 holds.
Expect pauses and pullbacks. These are normal after a sharp rebound.
Use pullbacks into key levels to evaluate risk, rather than chasing strength.
If 25,600 fails, reassess. The market may need to explore lower prices again.
Investors and traders are welcome to revisit this page as we may have additional insights coming from our orderFlow analysis methodology later today. Till then, the long-term structure remains constructive, even after the yesterday's decline and volatility..
orderFlow Intel Scores and How to Use Them
To guide traders and investors, orderFlow Intel uses a multi-timeframe scoring framework, with scores ranging from –10 to +10. Each score reflects a different time horizon and helps readers understand not just direction, but also confidence and timing.
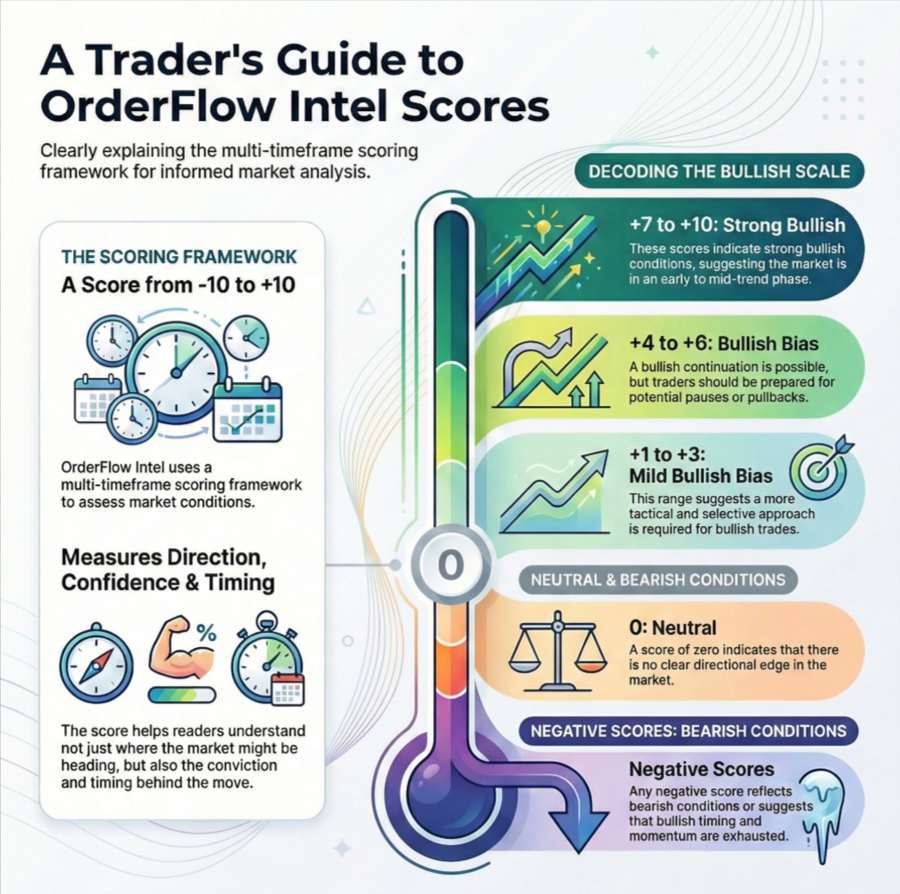
How to interpret the scale
+7 to +10: Strong bullish conditions, early to mid trend
+4 to +6: Bullish bias, continuation possible but with pauses
+1 to +3: Mild bullish bias, tactical and selective
0: Neutral, no clear edge
Negative scores: Bearish conditions or timing exhaustion
Current higher-timeframe scores for the NASDAQ
Long-term score: +3
The broader structure remains constructive. The recent selloff looks more like a washout than a breakdown, and longer-term value is stabilizing. This keeps the bigger-picture bullish case intact, even though volatility has increased.Medium-term score: +7
The medium-term outlook has improved meaningfully compared with yesterday. Buyers have regained control, value has migrated higher, and price is being accepted above prior balance areas. This reflects a bullish recovery phase rather than a fragile bounce.
We intentionally do not publish a fixed short-term score in articles, because short-term conditions can change within minutes or hours during the trading day. Publishing a static short-term score could confuse readers who encounter this analysis later.
How the framework works, in brief
orderFlow Intel combines an advanced AI learning system with a disciplined analyst methodology. Rather than relying on a single indicator, the framework evaluates how price interacts with key reference levels while weighing buying and selling pressure, volume behavior, and acceptance versus rejection across multiple time horizons.
The guiding principles are:
Higher timeframes define the structural direction.
Medium timeframes show who is gaining control.
Shorter timeframes are used for timing and execution, and therefore change more frequently.
This separation helps avoid a common mistake: confusing a bullish trend with a good entry.
For readers interested in live trade ideas and short-term timing, we regularly share opinions and setups in our Telegram channel:
👉 https://t.me/investingLiveStocks
For example, during today’s NASDAQ move, we initiated a long position around 25,609, took a first partial profit near 25,637, moved the stop to entry to eliminate risk, and later took another profit near 25,706, while keeping additional targets open. These are opinions based on real-time analysis, not financial advice, and many are informed by orderFlow Intel insights as market conditions evolve
Trader Update – NASDAQ, 16 minutes are the US market open

The washout phase of yesterday is complete.
Buyers are rebuilding control at a higher level, and the broader bullish recovery thesis remains valid.
Current orderFlow Intel scores (–10 to +10 scale):
Long-term: +4 – Structure repaired after the washout
Medium-term: +7 – Bullish recovery confirmed, value migrating higher
Short-term: Timing-dependent – Selective only, avoid chasing after extended moves
Key takeaway: the trend has improved meaningfully, but execution still matters. Pullbacks and reactions around key levels will offer better risk-reward than chasing strength.
Trade ideas and short-term timing updates may follow later as conditions evolve.
------------------------------------------------------------
Trader Update
Thursday, 15 January 2026 – 12:09 ET
The washout phase is complete, and the NASDAQ continues to show signs that buyers are rebuilding control at higher levels.
Since the U.S. session open, price briefly dipped below VWAP and yesterday’s upper deviation, but that move failed to gain acceptance. Buyers stepped back in quickly, reclaiming VWAP and pushing price higher again. This type of failed intraday breakdown is typically constructive in a bullish recovery phase and suggests that selling pressure is being absorbed rather than expanded.
From an orderFlow Intel perspective, the medium-term outlook remains bullish, while short-term conditions are becoming more location-dependent as price approaches prior high-volume areas. The region between 25,960 and 26,000 remains an important zone to monitor, as it includes prior session high-volume nodes and the psychologically important 26,000 level.
Updated orderFlow Intel scores (–10 to +10 scale):
Long-term: +4 – Structure repaired after the washout
Medium-term: +7 – Bullish recovery intact, value accepted higher
Short-term: Tactical only – Expect two-way trade and pauses near resistance
Key takeaway: the broader bullish recovery thesis remains valid, but traders should continue to avoid chasing strength and instead focus on reactions around key levels and VWAP. Further updates may follow later in the session as order flow conditions evolve.
---------------------------------------------------------------------------------
End of Day Trader Update
Thursday, 15 January 2026
The NASDAQ delivered a strong recovery session after the earlier washout, confirming that downside pressure has eased and that buyers were able to rebuild control at higher levels during the day. The rebound from the lows near 25,560 toward the mid-25,900s validated the broader bullish recovery thesis we outlined earlier.
That said, the session also ended with important nuance. Despite the strength, price did not complete the upside auction into the 25,987–26,000 naked high-volume area. Late in the day, order flow showed increasing two-way trade and profit-taking, and the market closed below the daily high-volume node and below the midpoint of the daily range. This signals acceptance is in progress, but not yet finalized.
orderFlow Intel scores at the close (–10 to +10 scale):
Long-term: +4 – The washout phase is repaired and structure remains constructive.
Medium-term: +5 – The bullish recovery succeeded, but momentum transitioned into rotation rather than continuation.
Short-term: Neutral – Directional edge faded into the close as the market shifted into balance.
What this means going forward:
The broader bullish recovery thesis remains valid, but the market has moved from impulse into negotiation. Holding above the repaired value zone around 25,600–25,640 will be key for bulls to maintain control. A renewed push higher would require fresh acceptance above today’s high-volume areas, while failure to hold repaired value would open the door to further consolidation.
In short, today resolved the downside risk, but did not yet confirm a breakout. Traders should expect rotation and selective opportunities, rather than one-directional follow-through, unless new acceptance develops.
We’ll continue monitoring price and order flow closely and may provide additional insights as conditions evolve.
