Yesterday, the Nasdaq Composite ended the day around the highs as the market continues to look through the beat in the US CPI report. As previously mentioned, the path of least resistance looks to be to the upside as long as growth remains pretty much stable, and the Fed doesn’t restart tightening. In the first case, the labour market will need to keep on being resilient, while in the second case, inflation should not start trending higher so much that the Fed is forced to change course.
Nasdaq Composite Technical Analysis – Daily Timeframe
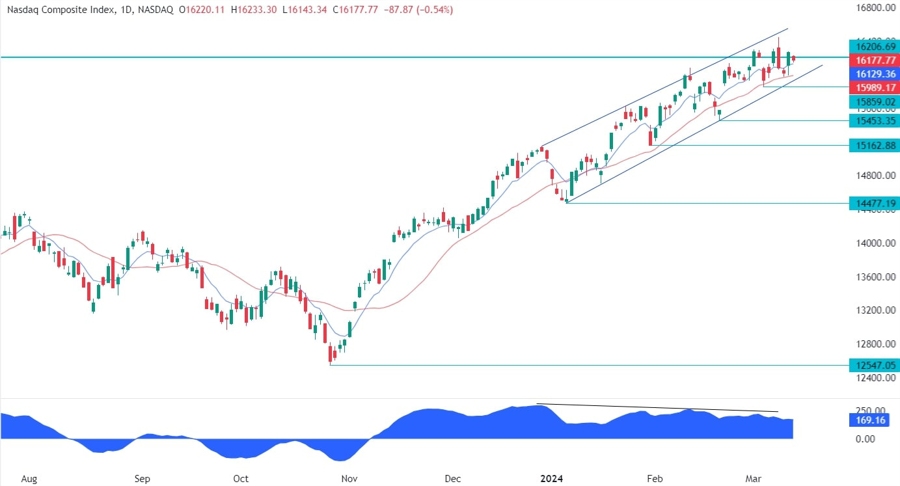
On the daily chart, we can see that the Nasdaq Composite is consolidating around the highs. From a risk management perspective though, the buyers will have a much better risk to reward setup around the trendline where we can also find the red 21 moving average for confluence. The sellers, on the other hand, will want to see the price breaking lower to invalidate the bullish setup and increase the bearish bets into new lows.
Nasdaq Composite Technical Analysis – 4 hour Timeframe
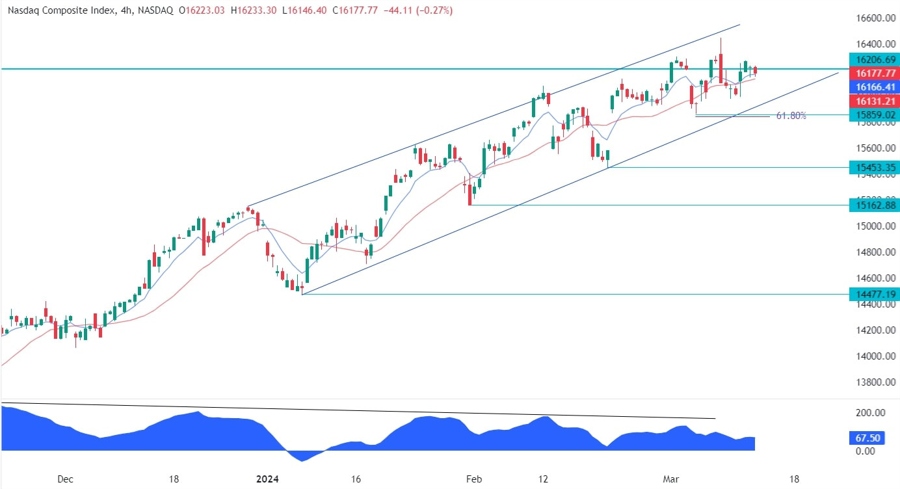
On the 4 hour chart, we can see that the price has been diverging with the MACD for a long time. This is generally a sign of weakening momentum often followed by pullbacks or reversals. We can also notice that the price action formed what looks like a rising wedge, so if the price were to break below the trendline, the sellers will have much more conviction to look for new lows with the base of the wedge at 14477 being the ultimate target.
Nasdaq Composite Technical Analysis – 1 hour Timeframe
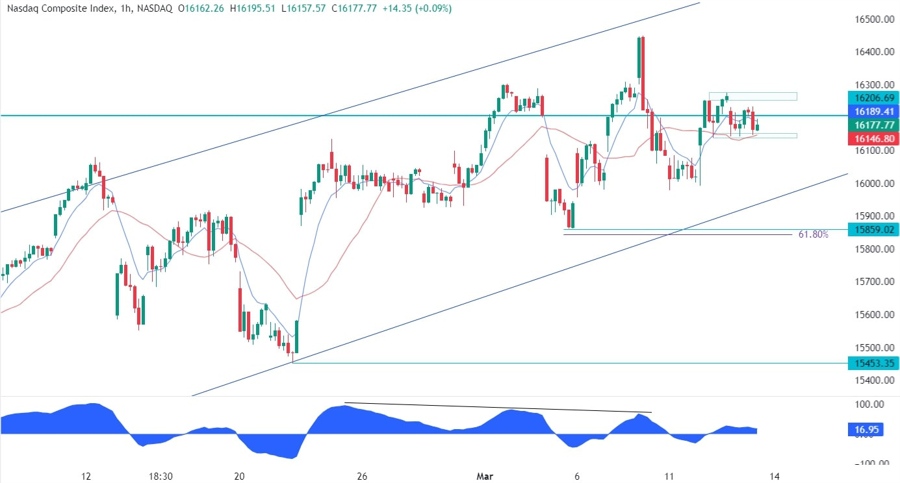
On the 1 hour chart, we can see that the price is now trading in a “mini” range between the 16145 support and the 16270 resistance. A break to the upside should lead to a rally into new highs, while a break to the downside is likely to trigger a drop into the trendline.
Upcoming Events
Tomorrow we conclude the week with the University of Michigan Consumer Sentiment survey.


