Yesterday, the Nasdaq Composite finished the day negative as some weak US data started to weigh a bit on sentiment. The ISM PMIs recently missed expectations with notably the employment indexes showing contraction. The ADP yesterday missed forecasts and the Job Openings were lower than expected with negative revisions to the prior figures. Moreover, we had Fed Chair Powell testifying to Congress, but he basically reaffirmed their patient approach stressing that the timing for rate cuts will be determined by the incoming data.
Nasdaq Composite Technical Analysis – Daily Timeframe

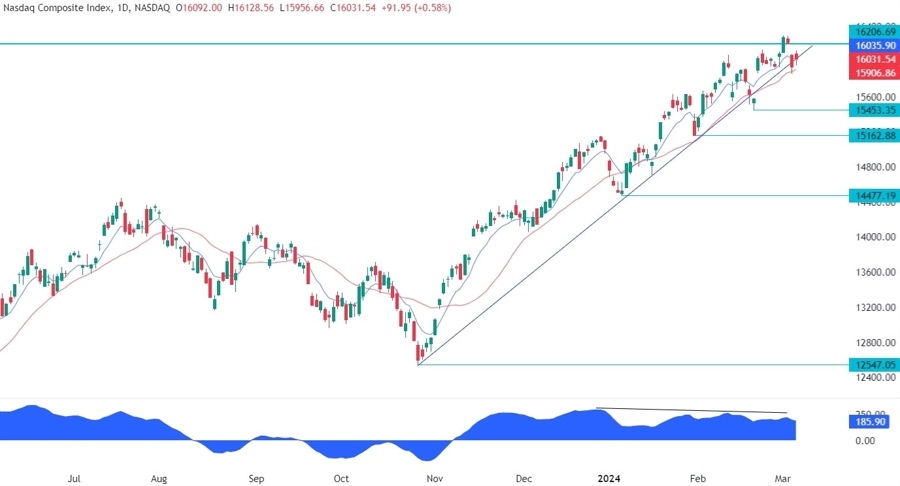
On the daily chart, we can see that the Nasdaq Composite resisted the breakdown bouncing on the red 21 moving average with the buyers stepping in to position for a rally into a new all-time high. The sellers, on the other hand, will likely keep on piling in around these levels and increase the bearish bets into the 15453 level in case the price breaks the moving average.
Nasdaq Composite Technical Analysis – 4 hour Timeframe

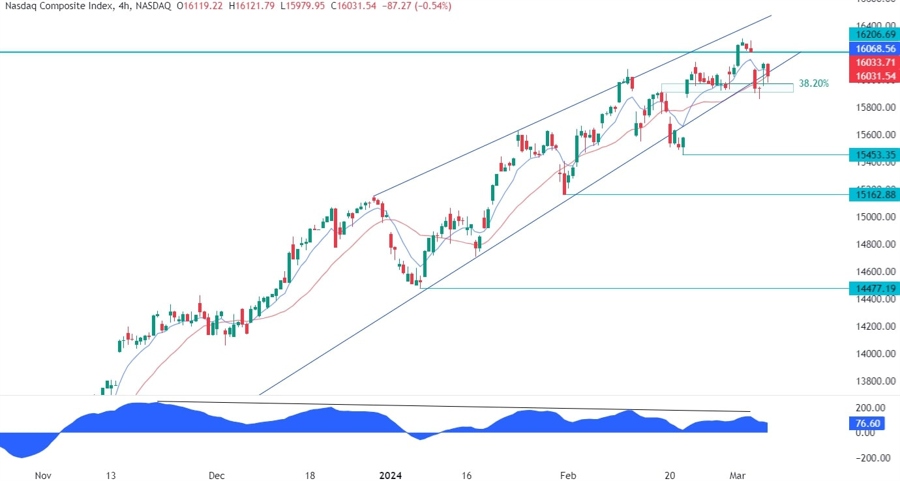
On the 4 hour chart, we can see that the price has been diverging with the MACD for a long time. This is generally a sign of weakening momentum often followed by pullbacks or reversals. We can also notice that the price action formed a rising wedge, so if the price breaks below the 15950 support zone, the sellers will have much more conviction to look for new lows with the base of the wedge at 14477 being the ultimate target.
Nasdaq Composite Technical Analysis – 1 hour Timeframe

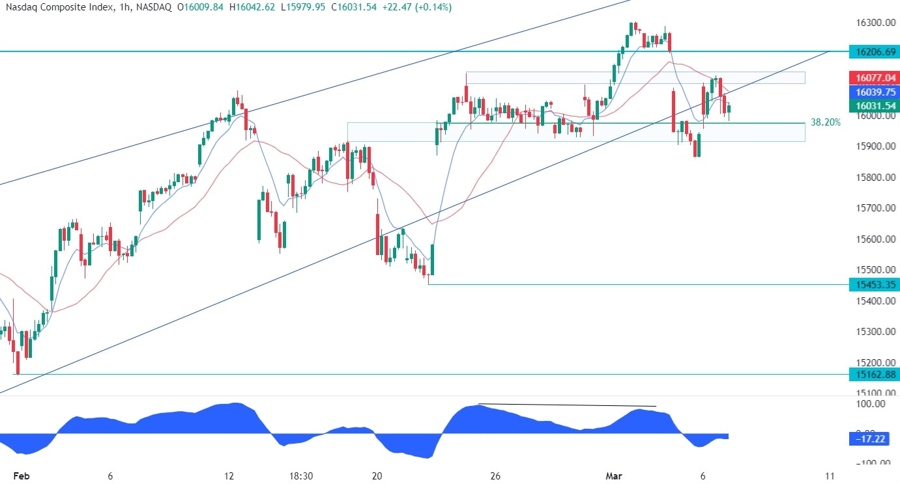
On the 1 hour chart, we can see that the price yesterday got rejected from the resistance we marked in the previous article. The buyers will need to break above this resistance to increase the bullish bets into new highs. The sellers, on the other hand, will want to see the price breaking below the support to trigger a selloff into new lows.
Upcoming Events
Today we get the latest US Jobless Claims figures, while tomorrow we conclude the week with the US NFP report.
