Yesterday, the Nasdaq Composite continued to consolidate as the market is taking a breather after the strong rally following the Nvidia earnings report. The big miss in the US Consumer Confidence yesterday didn’t spark any meaningful reaction as one bad data point amid lots of good ones is not enough to change anything. The market participants might be waiting for an important catalyst to push the price in either direction and we will get many of them in the next couple of weeks.
Nasdaq Composite Technical Analysis – Daily Timeframe
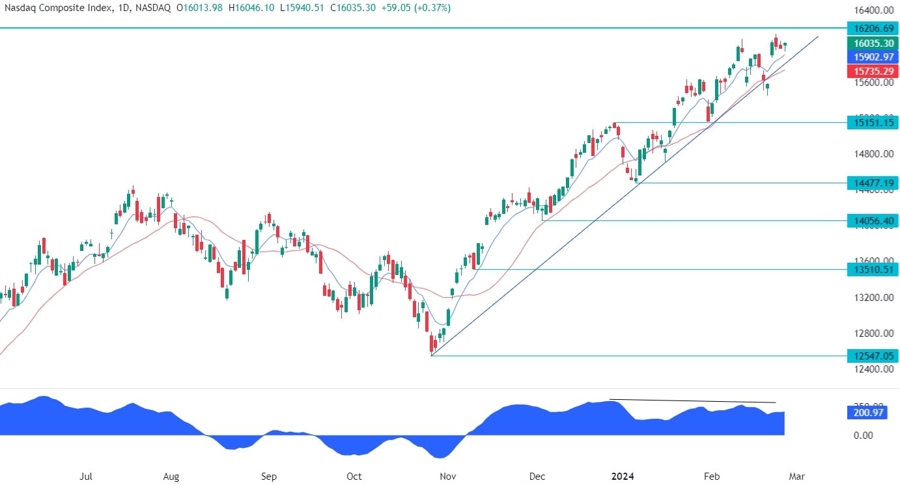
On the daily chart, we can see that the Nasdaq Composite continues to consolidate just beneath the all-time high as the market is probably waiting for a catalyst. From a risk management perspective, the buyers will have a good risk to reward setup around the trendline where we can also find the red 21 moving average for confluence. The sellers, on the other hand, will want to see the price breaking lower to invalidate the bullish setup and position for a drop into the 15150 support.
Nasdaq Composite Technical Analysis – 4 hour Timeframe
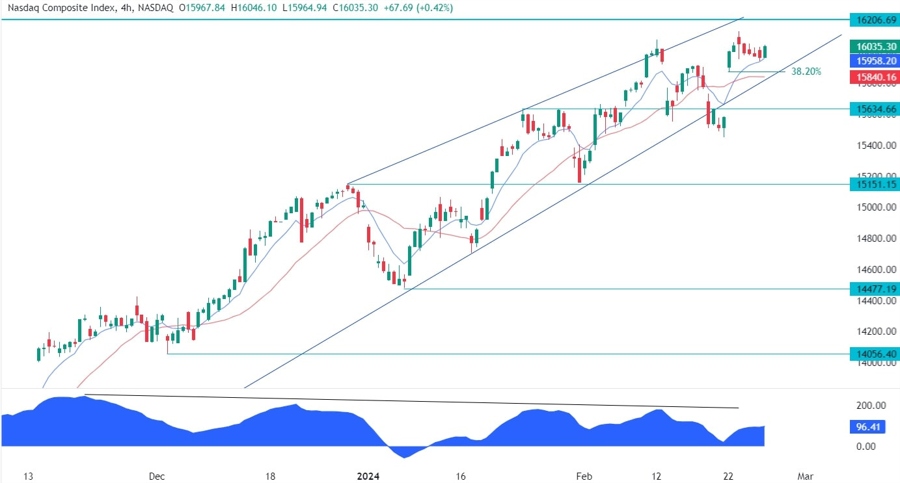
On the 4 hour chart, we can see that the price has been diverging with the MACD for a long time. This is generally a sign of weakening momentum often followed by pullbacks or reversals. In this case, we got pullbacks into the bottom trendline where the price kept on bouncing from as the buyers continued to pile in. We can also notice that we might have formed a rising wedge right at the all-time high. It will be important for the buyers to break out into new highs as a break lower could trigger a selloff into the base of the wedge at 14477.
Nasdaq Composite Technical Analysis – 1 hour Timeframe
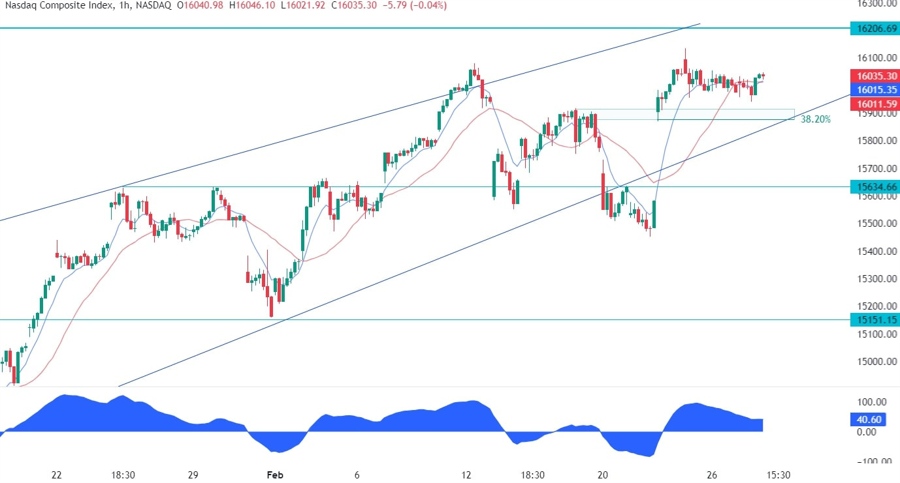
On the 1 hour chart, we can see that we have a support zone around the 15900 level where we can also find the 38.2% Fibonacci retracement level for confluence. This is where we can expect the buyers to pile in with a defined risk below the trendline to target a new all-time high. The sellers, on the other hand, can only wait for a break below the trendline to position for a bigger drop into the 14477 level.
Upcoming Events
Tomorrow we will see the US PCE and the latest US Jobless Claims figures. On Friday, we conclude the week with the US ISM Manufacturing PMI.


