Yesterday, the Nasdaq Composite started to rally at the open, but the gains were quickly erased a couple of hours later as the market turned more defensive ahead of the US CPI report later today. This is undoubtedly an important event which could shake out the market with a hot report likely triggering a selloff, at least in the short term. Conversely, weak data across the board might even put a March rate cut back on the table and give the stock market another boost. Buckle up because it’s going to be an important day which will likely define the direction for the next few weeks.
Nasdaq Composite Technical Analysis – Daily Timeframe
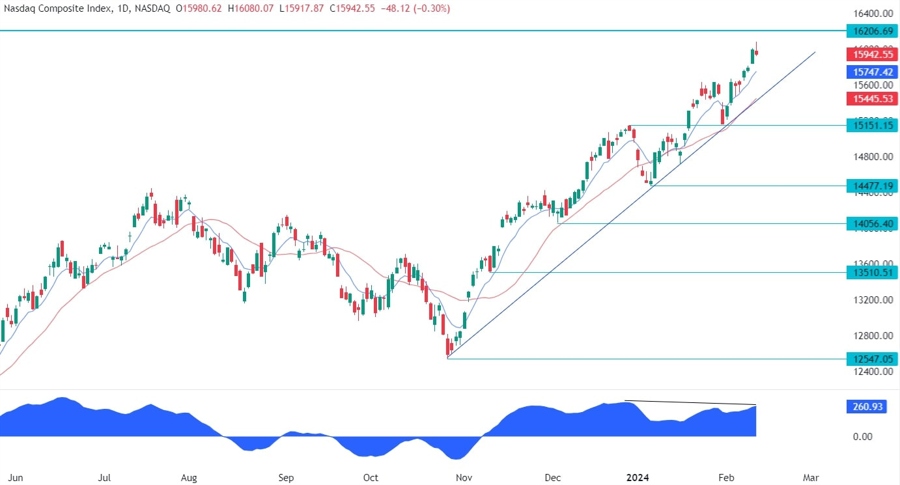
On the daily chart, we can see that the Nasdaq Composite yesterday tried to extend the rally into the all-time high but failed as some profit taking unfolded ahead of the US CPI report today. From a risk management perspective, the buyers will have a much better risk to reward setup around the trendline where they will also find the red 21 moving average for confluence. The sellers, on the other hand, will want to see the price breaking below the trendline to change the overall bias from bullish to bearish and start targeting new lows.
Nasdaq Composite Technical Analysis – 4 hour Timeframe
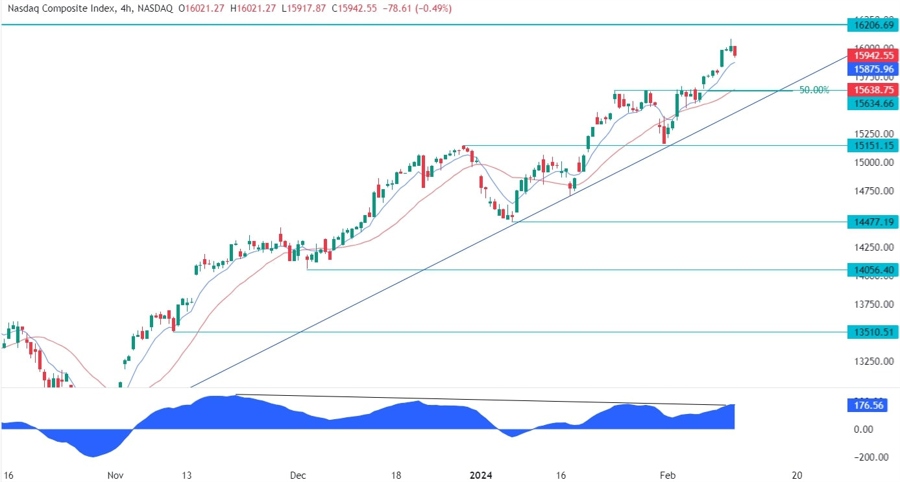
On the 4 hour chart, we can see that in case we get a pullback, the buyers will have two key support zones where they can lean onto. The first one will be the resistance now turned support around the 15635 level where they will also find the confluence with the 50.0% Fibonacci retracement level and the red 21 moving average. The second one will be around the trendline where there will be the confluence with the daily 21 moving average.
Nasdaq Composite Technical Analysis – 1 hour Timeframe
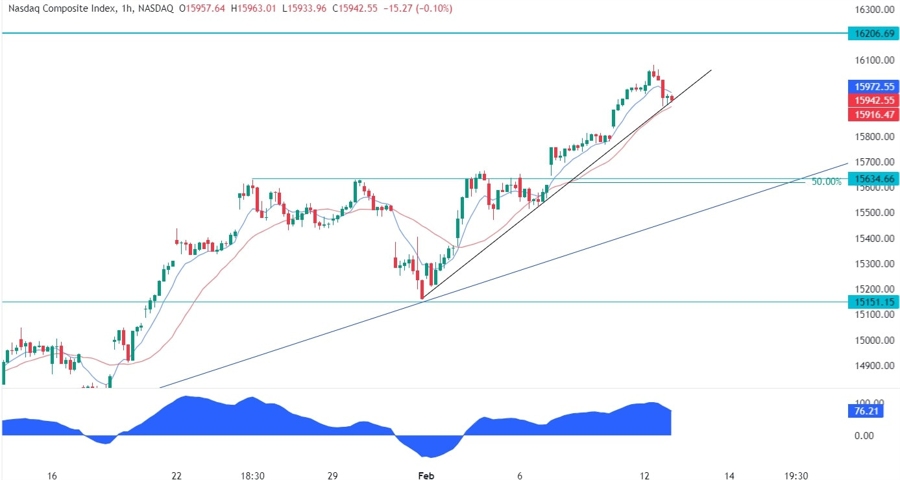
On the 1 hour chart, we can see that we have a minor trendline which is defining the current uptrend with the red 21 moving average adding extra confluence. This is where aggressive buyers are likely to lean onto to position for new highs while the sellers will want to see the price breaking lower to pile in and target a pullback into the 15635 support and the major trendline.
Upcoming Events
Today we have the main event of the week, that is, the US CPI report. On Thursday we will see latest US Jobless Claims figures and the US Retail Sales. Finally, on Friday, we conclude the week with the US PPI data and the University of Michigan Consumer Sentiment survey.
