Yesterday, the Nasdaq Composite closed the day at new all-time highs as the market continues to be supported by the Mag7 stocks. This week was basically uneventful with just the ISM Services PMI being the only notable release and, although it surprised to the upside across the board, the jump in prices paid index could be a worrying signal. Today we will see the latest US Jobless Claims figures and then the calendar is empty until the US CPI next Tuesday. The market should start to think about how it wants to position itself into the inflation report.
Nasdaq Composite Technical Analysis – Daily Timeframe
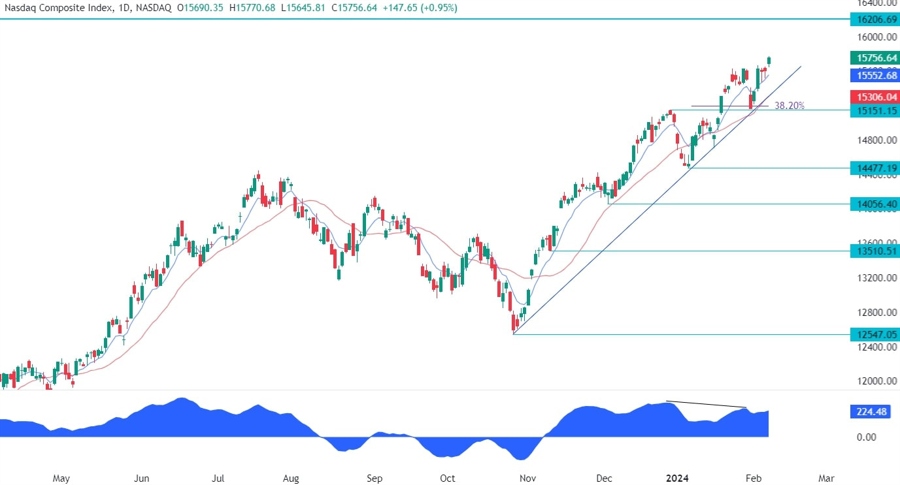
On the daily chart, we can see that the Nasdaq Composite yesterday finally broke the resistance and rallied to new highs. The index is now just 3% away from the all-time high and that’s certainly what the buyers are targeting at the moment. If we get a bigger pullback from here, we can expect the buyers to lean on the trendline to position for the all-time high. The sellers, on the other hand, will want to see the price breaking below the trendline to invalidate the bullish setup and position for a drop into the 14477 level.
Nasdaq Composite Technical Analysis – 4 hour Timeframe
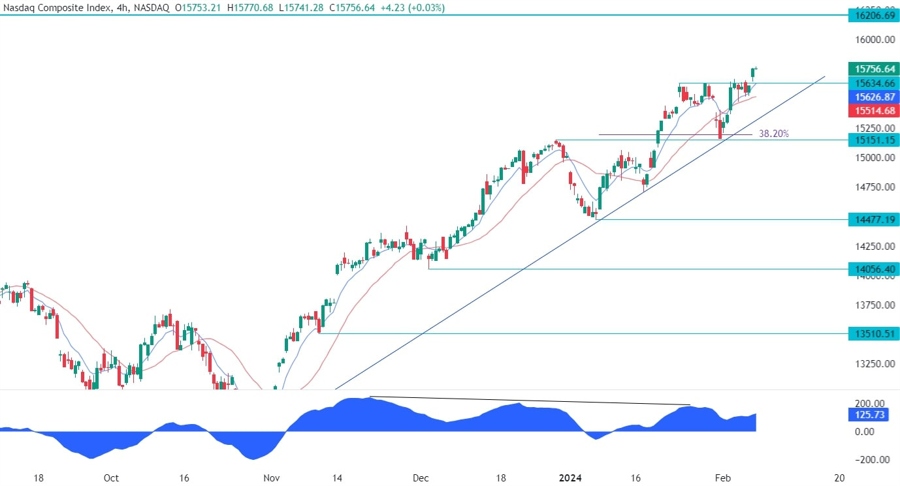
On the 4 hour chart, we can see more clearly how the price yesterday opened above the 15634 resistance and continued higher as the buyers increased the bullish bets into the all-time high. The sellers can’t do much here other than waiting for the price to reverse and fall back below the resistance to pile in and target a pullback into the major trendline.
Nasdaq Composite Technical Analysis – 1 hour Timeframe
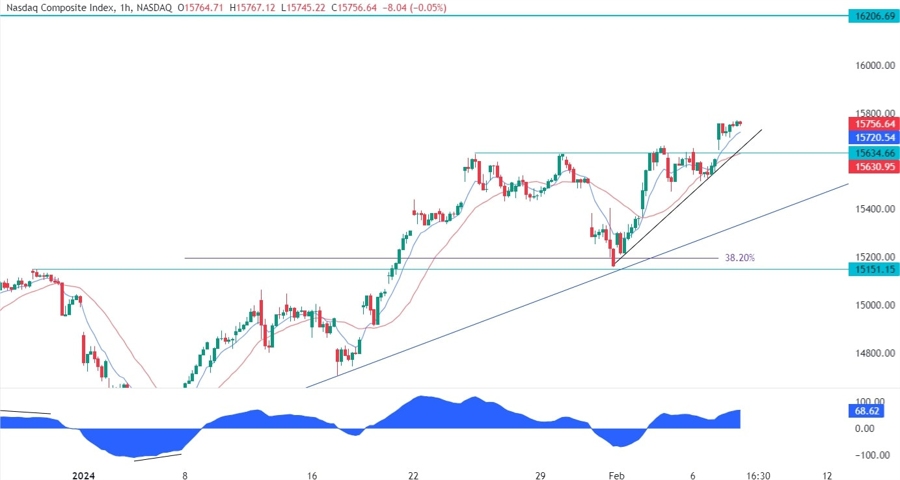
On the 1 hour chart, we can see that the resistance has now become support and we can also find the confluence with a minor trendline and the red 21 moving average. This is where we can expect the buyers to step in again with a defined risk below the support to position for new highs. The sellers, on the other hand, will want to see the price breaking lower to invalidate the bullish setup and target the major trendline.
