Yesterday, the Nasdaq Composite surged to new highs following the strong US Jobless Claims figures as the market continues to be supported by the soft-landing narrative. It looks like the pressure from the repricing of rate cuts expectations is already in the rear-view mirror and the market is looking forward to next week where the Fed’s preferred measure of inflation is expected to confirm the disinflationary trend.
Nasdaq Composite Technical Analysis – Daily Timeframe
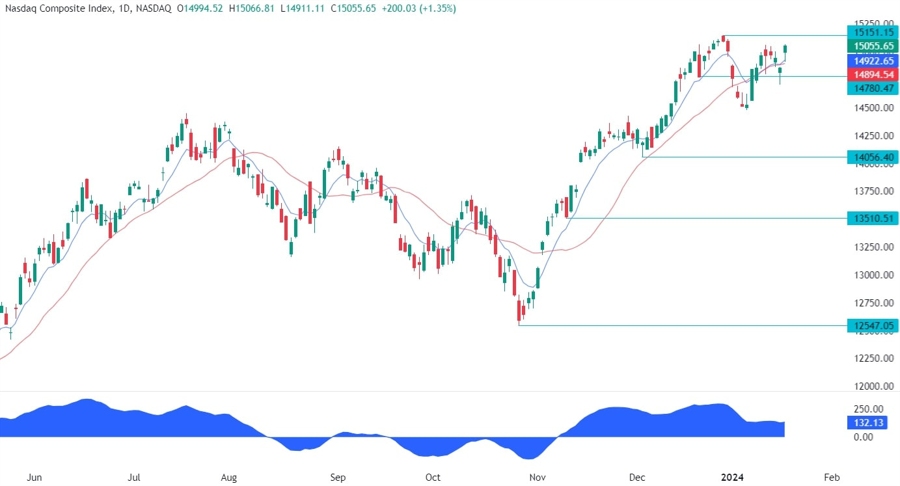
On the daily chart, we can see that the Nasdaq Composite pulled back into the key 14780 support level and bounced back as the buyers piled in to position for a rally into a new high. The sellers, on the other hand, might want to wait for the price to reach the cycle high before considering shorts.
Nasdaq Composite Technical Analysis – 4 hour Timeframe
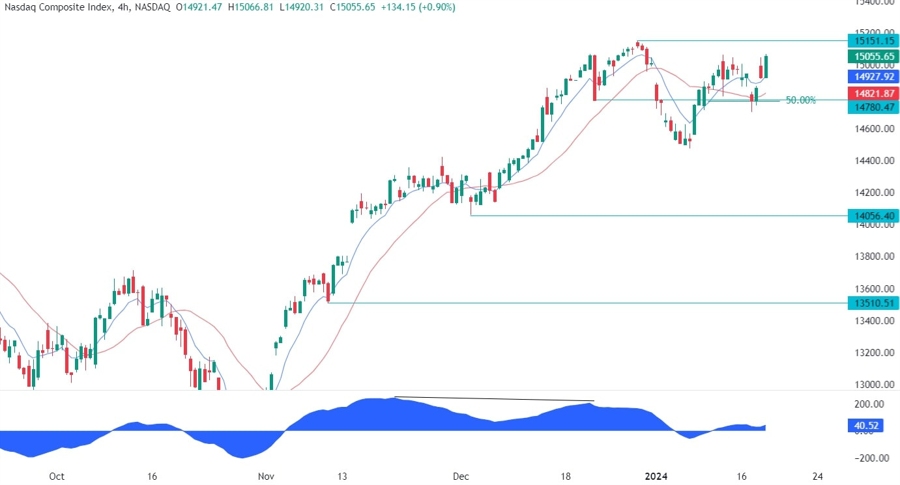
On the 4 hour chart, we can see more clearly the bounce right from the key level where we had also the confluence with the 50% Fibonacci retracement level and the red 21 moving average. A break above the cycle high should see the buyers increasing their bullish bets while the sellers will likely wait to see a fakeout before stepping in more strongly.
Nasdaq Composite Technical Analysis – 1 hour Timeframe
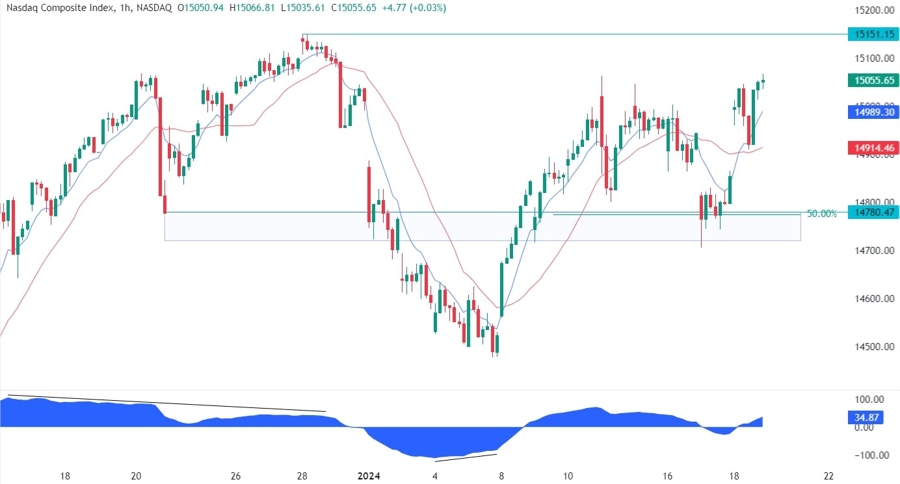
On the 1 hour chart, we can see that the price run into the previous highs before the market closed yesterday. There’s not much to do here other than waiting for the price to reach the key levels.
Upcoming Events
Today, the only notable event will be the University of Michigan Consumer Sentiment survey.
