Yesterday, the Nasdaq Composite dropped following a slight beat in the US CPI report and strong Jobless Claims figures. A deeper pullback seemed likely at that point with the probability of a rate cut in March being pushed back, but after a couple of hours everything reversed, and the market erased almost all the losses. The catalyst might have been a neutral Fedspeak after the data with no strong pushback against a rate cut in March. Today, the only notable event on the agenda will be the US PPI data and an upside surprise might increase the pressure on the market.
Nasdaq Composite Technical Analysis – Daily Timeframe
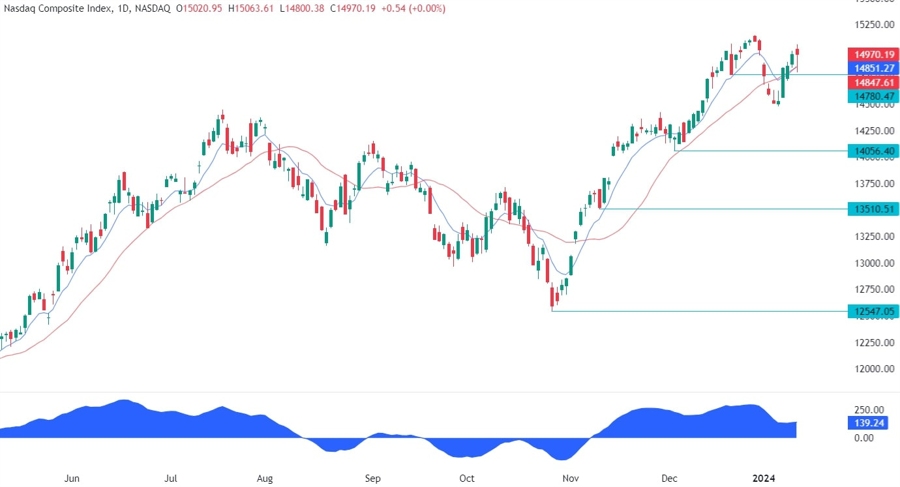
On the daily chart, we can see that the Nasdaq Composite yesterday dropped into the 14780 level and reversed soon after finishing the day basically flat. There’s not much to glean from this chart as the only level to watch out for is the high around the 15146 level.
Nasdaq Composite Technical Analysis – 4 hour Timeframe
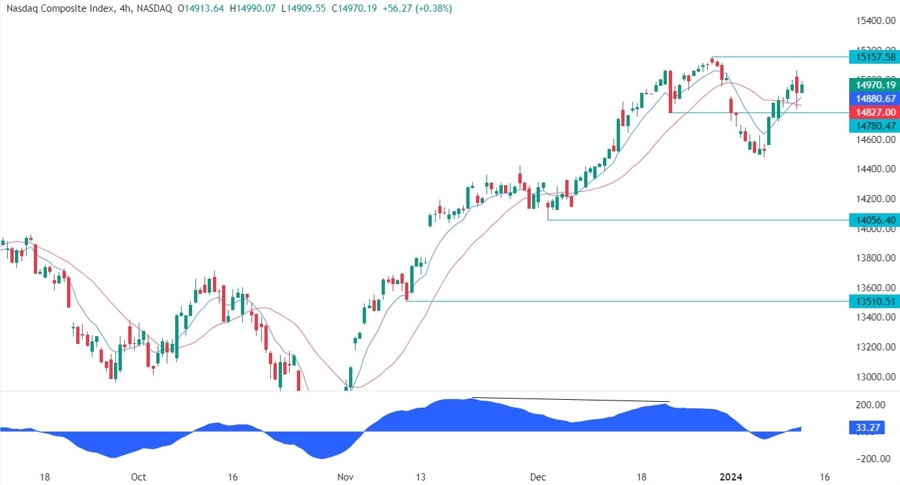
On the 4 hour chart, we can see more clearly the rejection near the 14780 level where we also got the moving averages crossover. The buyers should keep on targeting a new higher high, while the sellers are likely to step in around the high with a defined risk above it to position for a drop into the 14050 level.
Nasdaq Composite Technical Analysis – 1 hour Timeframe
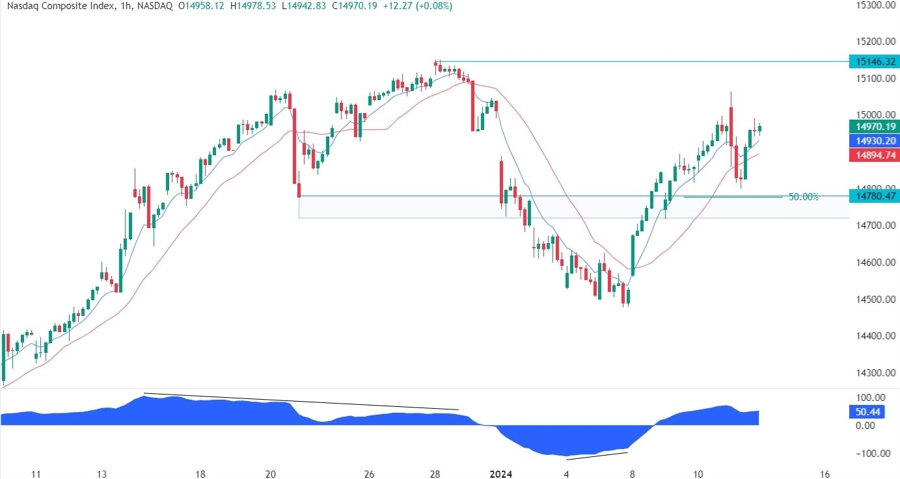
On the 1 hour chart, we can see more closely the yesterday’s price action with the index reversing near the key support zone where we had also the 50% Fibonacci retracement level for confluence. If the price were to break below this support zone, we can expect the sellers to increase the bearish bets into the 14050 level.
