Yesterday, the Nasdaq Composite erased half of the losses from the prior weeks in a single day. Despite the weaker NFP and ISM Services PMI reports last Friday, the stock market rallied across the board without a catalyst except some help from falling Treasury yields. This might have been just a relief rally, so the buyers should still keep on being cautious given that we still have the US CPI report ahead of us.
Nasdaq Composite Technical Analysis – Daily Timeframe
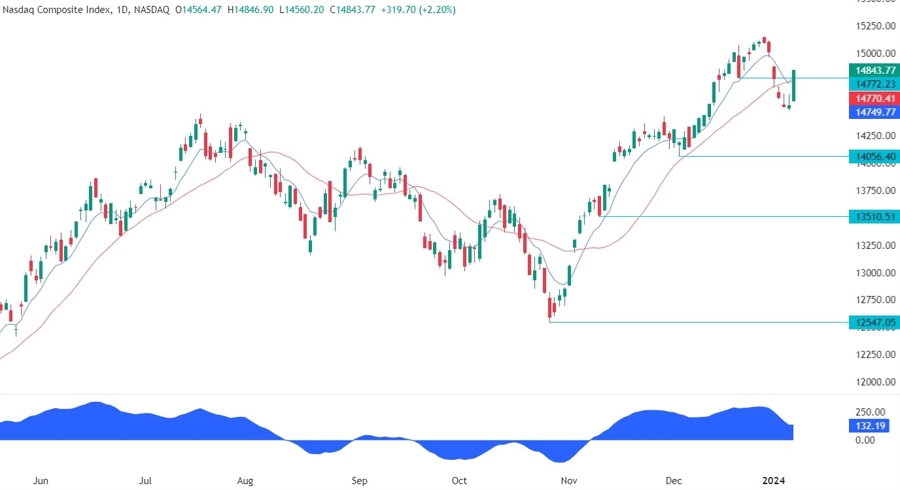
On the daily chart, we can see that the Nasdaq Composite rallied strongly yesterday with half of the prior losses being erased in a single day. The market was anyway a bit oversold as depicted by the price distance from the blue 8 moving average. In such instances, we can generally see a pullback into the moving average or some consolidation before the next move.
Nasdaq Composite Technical Analysis – 4 hour Timeframe
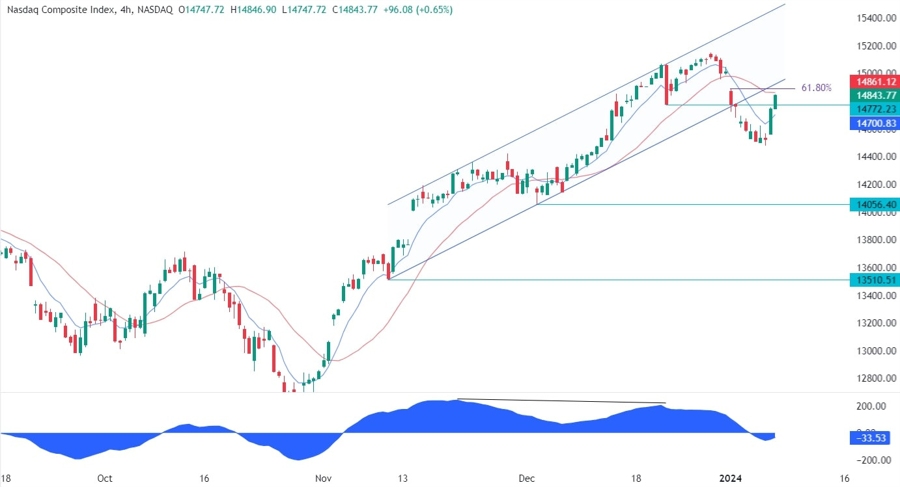
On the 4 hour chart, we can see that the price is now near the red 21 moving average where we can also find the 61.8% Fibonacci retracement level for confluence. This is where the sellers are likely to step in with a defined risk above the moving average to position for a drop into the 14050 level. The buyers, on the other hand, will want to see the price breaking higher to increase the bullish bets into new highs.
Nasdaq Composite Technical Analysis – 1 hour Timeframe
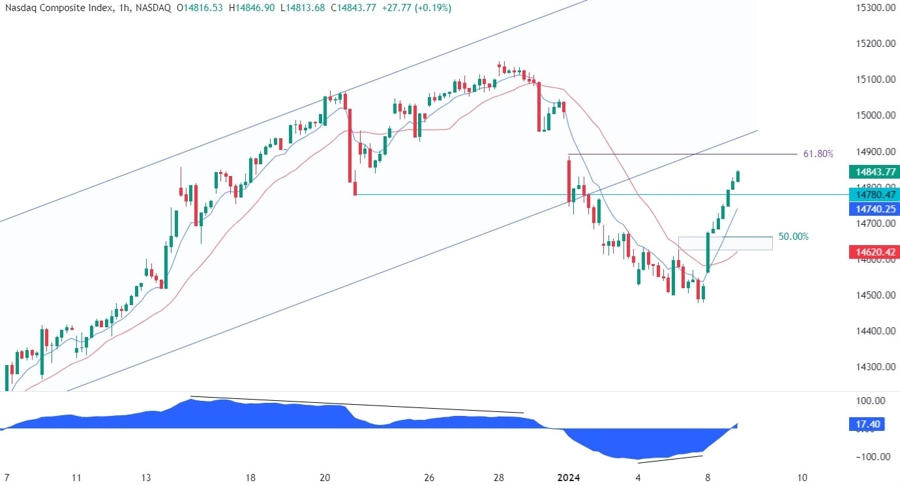
On the 1 hour chart, we can see that the price has been diverging with the MACD recently, which is generally a sign of weakening momentum often followed by pullbacks or reversals. In this case, we got a reversal as the price broke through the lower high at 14622 and extended the rally into the 14845 level. From a risk to reward perspective, the buyers will have a better setup around the previous swing high at 14622 where we can also find the confluence with the 50% Fibonacci retracement level and the red 21 moving average. If the sellers manage to break that zone as well, then we can expect the bearish momentum to pick up further and see a drop into the 14050 level.
Upcoming Events
This week is basically empty on the data front with the only two notable releases scheduled for Thursday when we will get the US CPI report and the US Jobless Claims figures.
