The Nasdaq Composite yesterday fell hard into the close with no clear catalyst. It might have been just profit taking as the market was anyway getting more and more overstretched. The only notable economic release was the US Consumer Confidence report where the data beat across the board. We are now close to the Christmas holidays and liquidity is likely to get thinner which increases the risk of bigger swings. Today the market will focus on the US Jobless Claims figures as the labour market continues to be a key spot to watch for the soft-landing narrative.
Nasdaq Composite Technical Analysis – Daily Timeframe
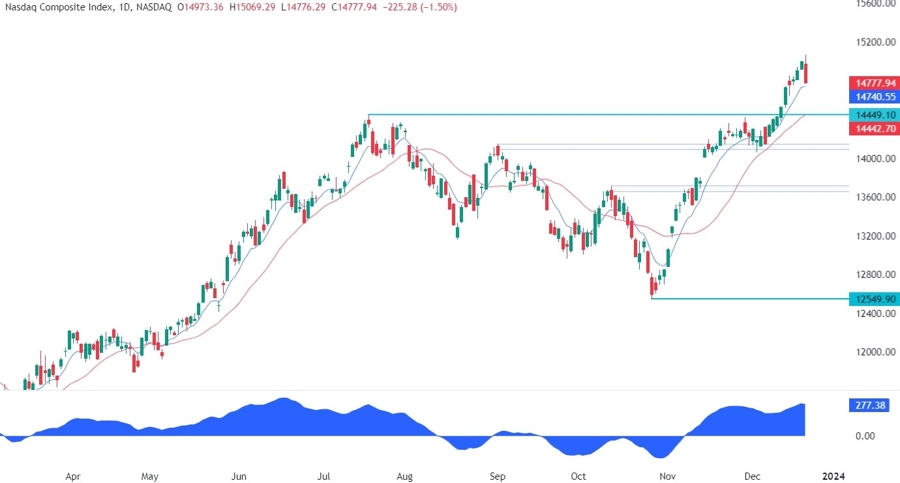
On the daily chart, we can see that the Nasdaq Composite yesterday dropped hard into the close as some profit taking might have ensued. A pullback was well overdue as the market got “a bit” overstretched. From a risk management perspective, the buyers will have a much better risk to reward setup around the 14449 level where we can also find the red 21 moving average for confluence.
Nasdaq Composite Technical Analysis – 4 hour Timeframe
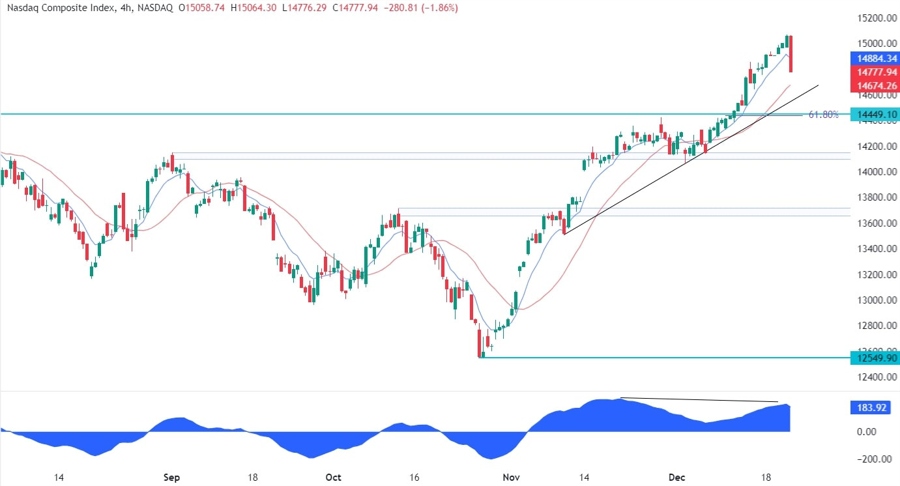
On the 4 hour chart, we can see that the recent breakout above the cycle high was diverging with the MACD. This is generally a sign of weakening momentum often followed by pullbacks or reversals. In this case, we can find some more confluence around the 14449 level as we can also find the trendline and the 61.8% Fibonacci retracement level. This gives the buyers an even stronger support zone where to lean on.
Nasdaq Composite Technical Analysis – 1 hour Timeframe
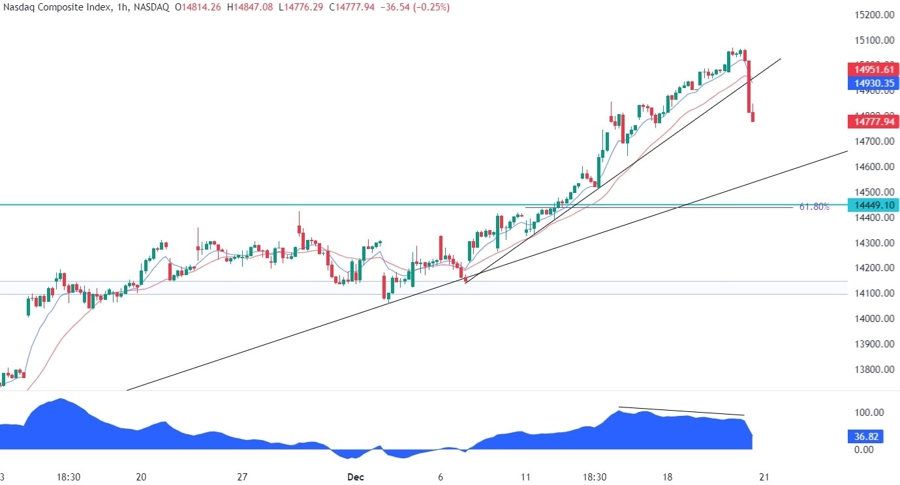
On the 1 hour chart, we can see that we have another divergence with the MACD which was signalling a loss of momentum. The buyers couldn’t defend the minor trendline and the red 21 moving average as the price fell below it and triggered even more selling with the sellers increasing their bearish bets into the 14449 support. That support zone will be they key spot to watch.
