The Nasdaq Composite continues to rise for inertia following the surprisingly dovish FOMC decision where the Fed increased the rate cuts expected in 2024 to three and Fed Chair Powell delivered some dovish comments. The data continues to point to a soft-landing as the latest US Jobless Claims and Retail Sales beat expectations, while the US PMIs missed on the manufacturing side and beat on the services one. The lack of bearish catalysts is supporting the upside for no, but the buyers should be careful going forward as one meaningfully negative news could trigger a quick selloff given the overstretched levels.
Nasdaq Composite Technical Analysis – Daily Timeframe
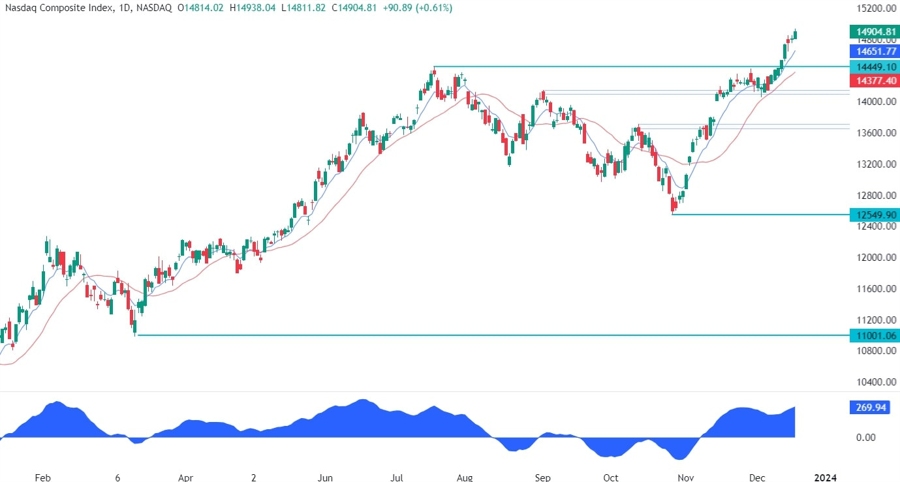
On the daily chart, we can see that the Nasdaq Composite yesterday continued to rise as the index is now moving for inertia following the dovish FOMC decision and some soft-landing economic data. From a risk management perspective, the buyers would be better off waiting for a pullback into the 14449 level where they will also find the red 21 moving average for confluence before taking new long positions.
Nasdaq Composite Technical Analysis – 4 hour Timeframe
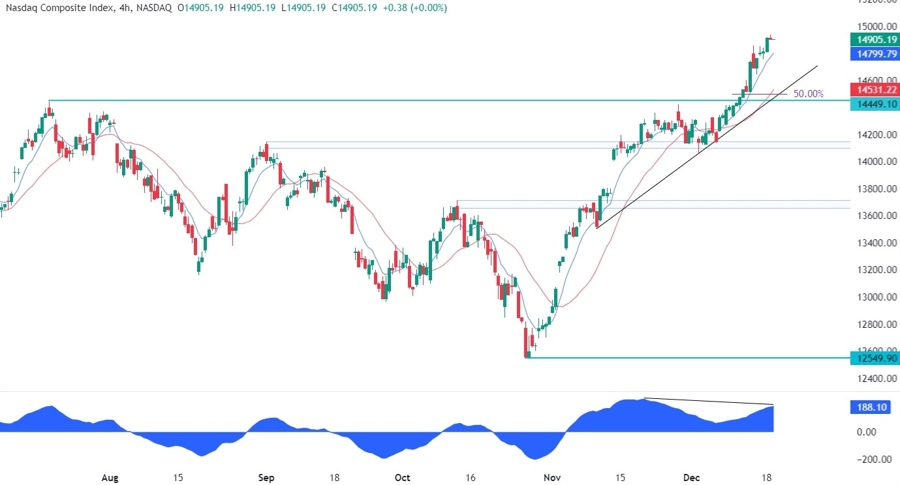
On the 4 hour chart, we can see that the recent breakout above the cycle high is diverging with the MACD. This is generally a sign of weakening momentum often followed by pullbacks or reversals. In this case, we have a trendline connecting the most recent swing lows and the buyers might want to lean on it as they will also find the confluence with the red 21 moving average and the 50% Fibonacci retracement level.
Nasdaq Composite Technical Analysis – 1 hour Timeframe
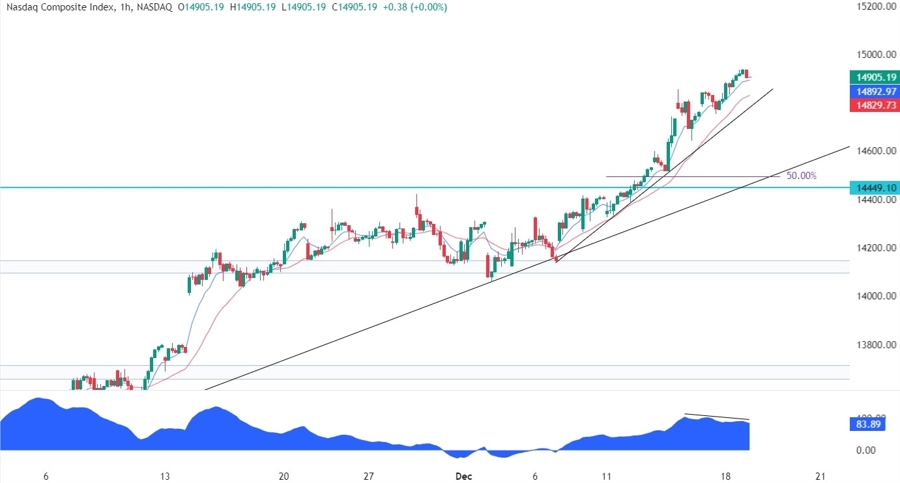
On the 1 hour chart, we can see that we have another minor trendline with a steeper slope. More aggressive buyers might want to lean on it as they also have the red 21 moving average for confluence. The sellers, on the other hand, will want to see the price breaking lower to position for a drop into the 14449 support and upon a further break lower, target the 14050 level.
Upcoming Events
This week is a bit empty on the data front as we head into the Christmas holidays. Tomorrow, we have the US Consumer Confidence report. On Thursday, we get the latest US Jobless Claims data, while on Friday we conclude the week with the US PCE report.
