Yesterday, the Nasdaq Composite held into gains despite some selling as the US data continued to point to a soft landing. In fact, the Retail Sales data beat expectations across the board with consumer spending remaining strong and the Jobless Claims figures improved further. The sentiment is extremely bullish, and the soft-landing outcome is a strong consensus. These are generally contrarian signals, but the market will likely need some catalysts to prove the soft landing scenario wrong, otherwise it might just keep on going up.
Nasdaq Composite Technical Analysis – Daily Timeframe
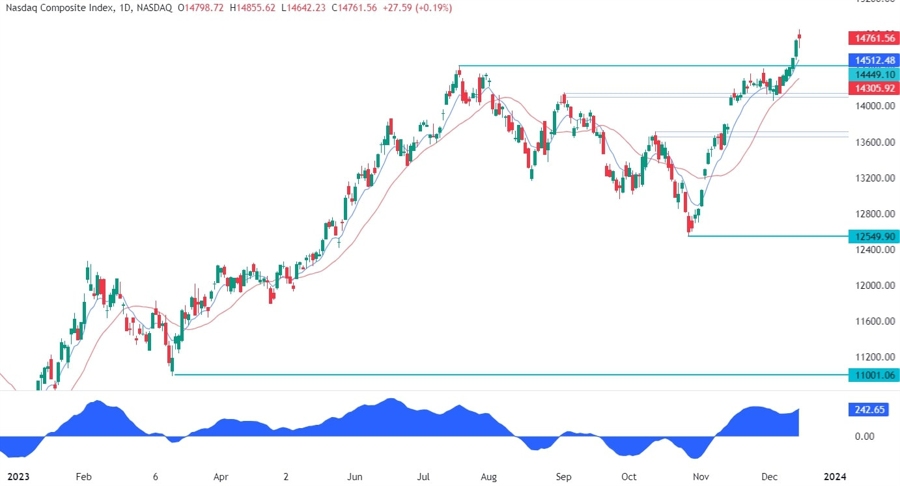
On the daily chart, we can see that the Nasdaq Composite yesterday held into gains despite some selling in the middle of the trading session. We can also notice that the price is a bit overstretched as depicted by the distance from the blue 8 moving average. In such instances, we can generally see a pullback into the moving average or some consolidation before the next move.
Nasdaq Composite Technical Analysis – 4 hour Timeframe
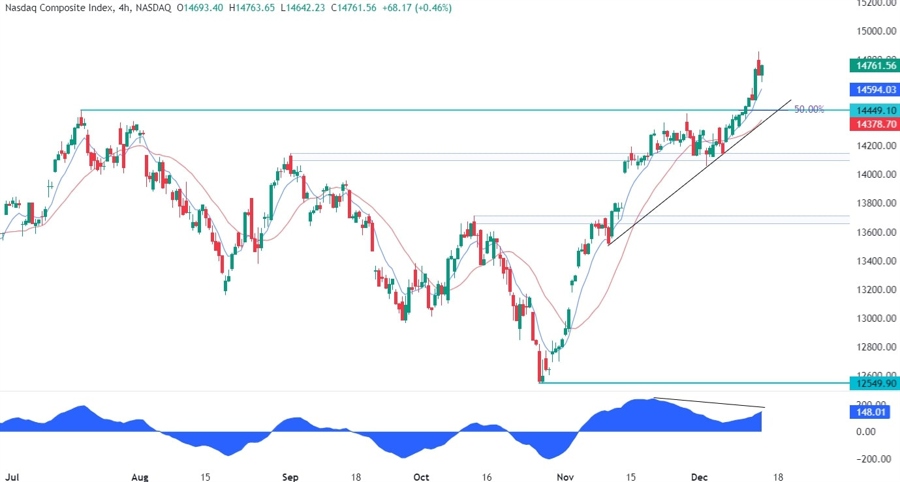
On the 4 hour chart, we can see that the recent breakout above the cycle high is diverging with the MACD. This is generally a sign of weakening momentum often followed by pullbacks or reversals. In this case, we have a trendline connecting the most recent swing lows and the buyers might want to lean on it as they will also find the confluence with the red 21 moving average and the 50% Fibonacci retracement level.
Nasdaq Composite Technical Analysis – 1 hour Timeframe
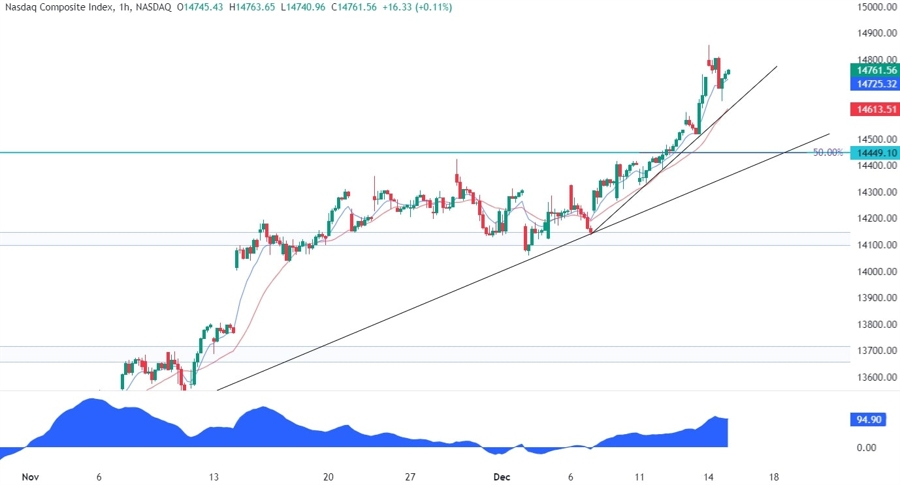
On the 1 hour chart, we can see that we have another minor trendline with a steeper slope. More aggressive buyers might want to lean on it as they will also have the red 21 moving average for confluence. The sellers, on the other hand, will likely pile in at every break lower with a break below the major trendline triggering a stronger selloff into the 14050 support.
Upcoming Events
Today the only notable event on the agenda is the release of the US PMIs.
