Yesterday, the Nasdaq Composite erased all the losses from the miss in the US ADP data seen on Wednesday as the US Jobless Claims beat forecasts across the board. Despite the softening in the labour market, we have yet to see a pickup in layoffs as for now it was all about the decrease in job offers. Today all eyes will be on the US NFP report as it could increase the amount of rate cuts expected in 2024 or reverse some of them. This and the US CPI report next Tuesday will be the last big events of 2023 before the FOMC rate decision on the 13th of December.
Nasdaq Composite Technical Analysis – Daily Timeframe
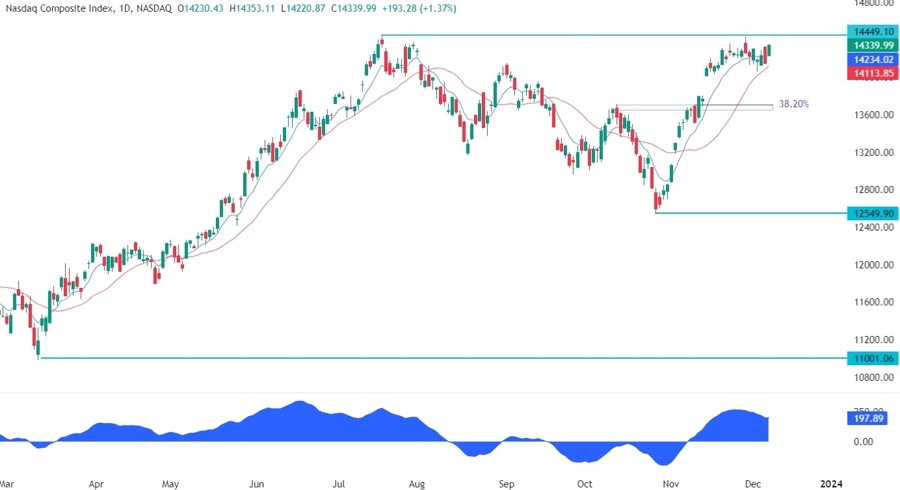
On the daily chart, we can see that the Nasdaq Composite continues to consolidate between the 21 moving average and the cycle high as the market is probably awaiting the next big catalyst. A break above the cycle high should see more buyers piling in to position for a rally into the all-time high around the 16200 level. On the other hand, a break below the 21 moving average should trigger a selloff into the 13700 support zone.
Nasdaq Composite Technical Analysis – 4 hour Timeframe
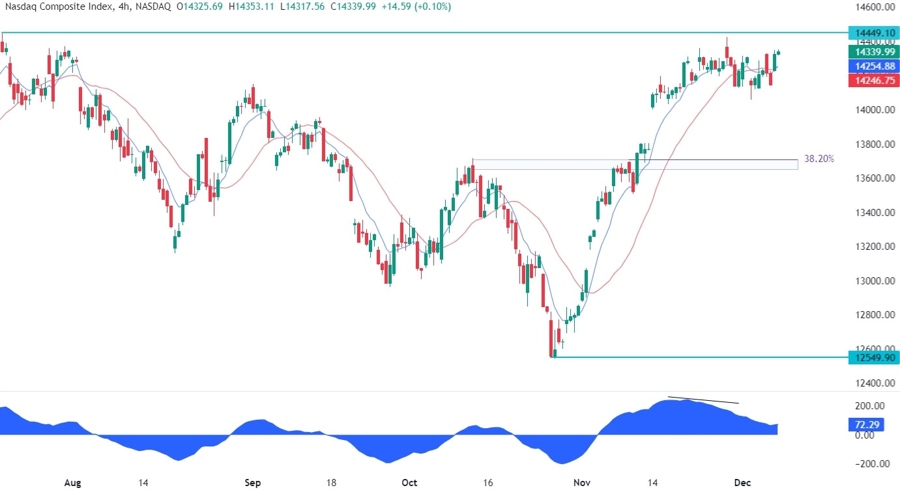
On the 4 hour chart, we can see that the price was diverging with the MACD into the cycle high. This is generally a sign of weakening momentum often followed by pullbacks or reversals. We indeed got a pullback into the daily 21 moving average where the price bounced from. From a risk management perspective, the buyers would have a much better risk to reward setup at the 13700 support where we can also find the 38.2% Fibonacci retracement level of the entire November rally.
Nasdaq Composite Technical Analysis – 1 hour Timeframe
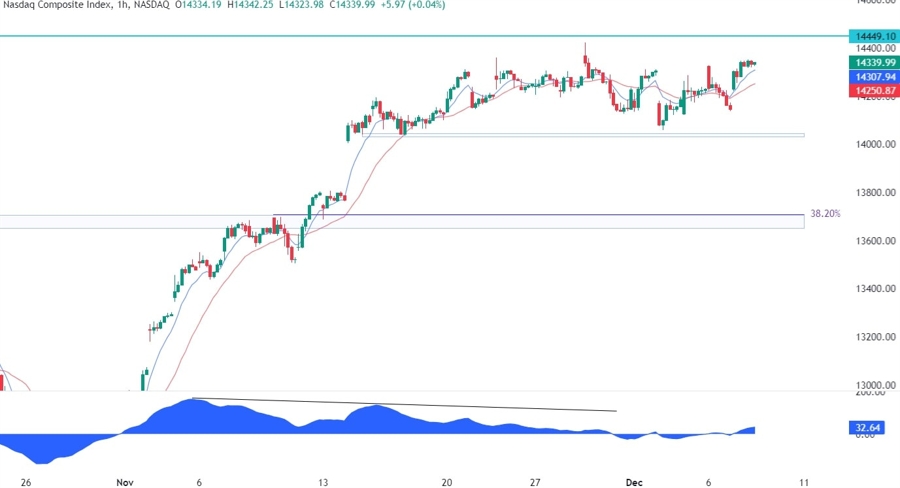
On the 1 hour chart, we can see more closely the rangebound price action between the cycle high and the minor support around the 14050 level. This range will likely be key now as a break to the upside should lead to a rally while a break to the downside should trigger a selloff into the 13700 support.
