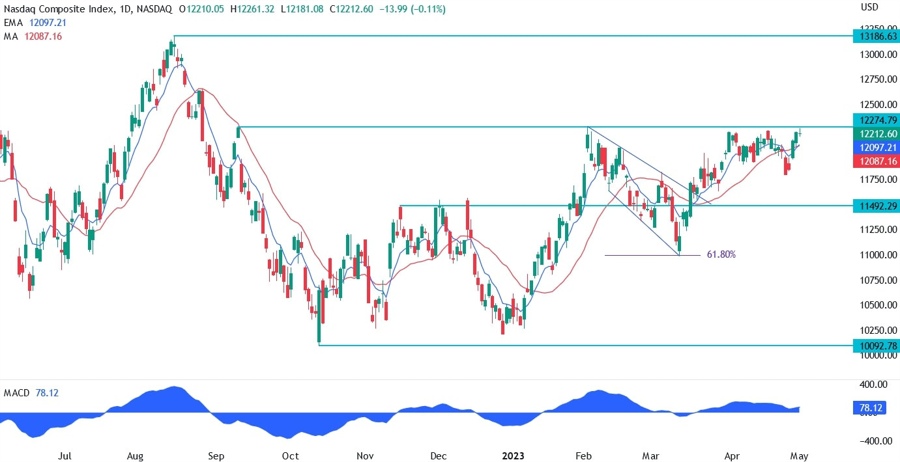
On the daily chart below for the Nasdaq , we can see that after a brief fall below the range created just beneath the key 12274 resistance, the price rallied back strongly and it’s now back again at the resistance. The latest rally was helped by better than expected data in the US GDP report and the beat in Jobless Claims after several weeks of misses.
The bad news though is that the ISM Manufacturing PMI yesterday beat forecasts and the inflation and employment sub-indexes returned back into expansion. As long as employment remains strong with a falling inflation the stock market can rise, but it’s harder to do so when inflation remains persistently high as well as that may force the Fed to keep hiking rates.
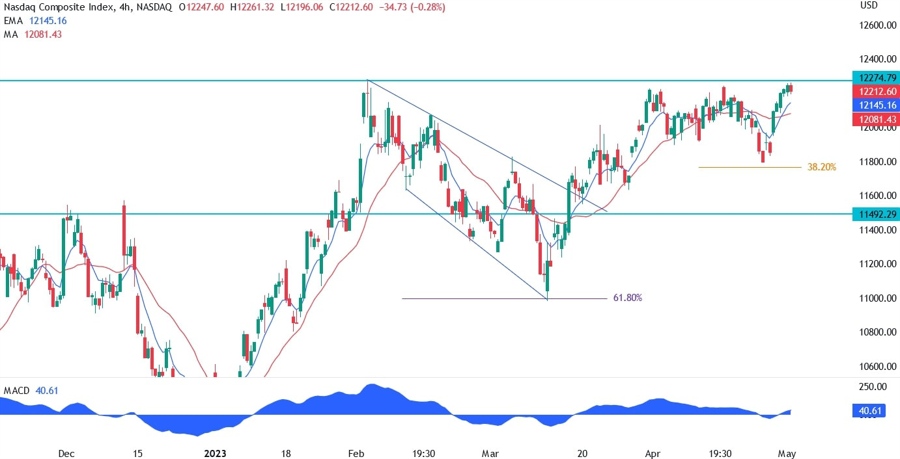
On the 4 hour chart below, we can see that the buyers may still be targeting new higher highs with the big bullish flag pointing to a 13000 extension. The latest bounce from the 50% Fibonacci retracement level had no pullbacks and given that the price is back at the key resistance and the ISM data yesterday is not that bullish, we may see a pullback here and probably again some consolidation.
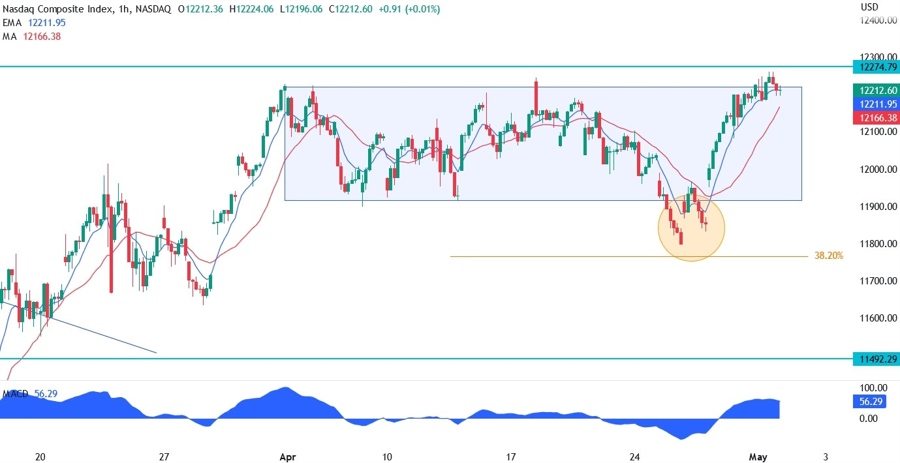
On the 1 hour chart below, we can see the recent fakeout highlighted by the orange circle and then the rally back towards the top of the range. This week is packed with top tier economic events like the ISM PMIs, the FOMC and the NFP, so we may see another breakout but the direction will be given by the data. More inflationary pressures should be negative for the market, while strong labour market data with easing inflationary pressures should be positive.