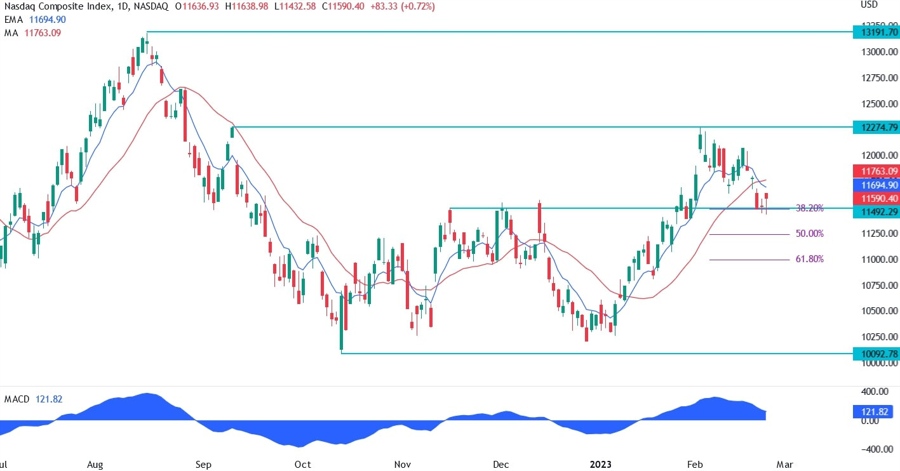
On the daily chart below, we can see that the price has now fallen to the key 11492 support where we can also find the 38.2% Fibonacci retracement level. This level will be key for both buyers and sellers.
Overall, the work for the buyers is more challenging as the market started to price in a higher terminal rate as many key economic data came in hot recently and there’s a chance the Fed will be forced to do more, ultimately causing a recession.
The moving averages have also crossed to the downside signalling a possible change in trend. We will have another set of key economic data soon and we will see if the January data was indeed just a blip, or the Fed has slowed the pace of hikes too early.
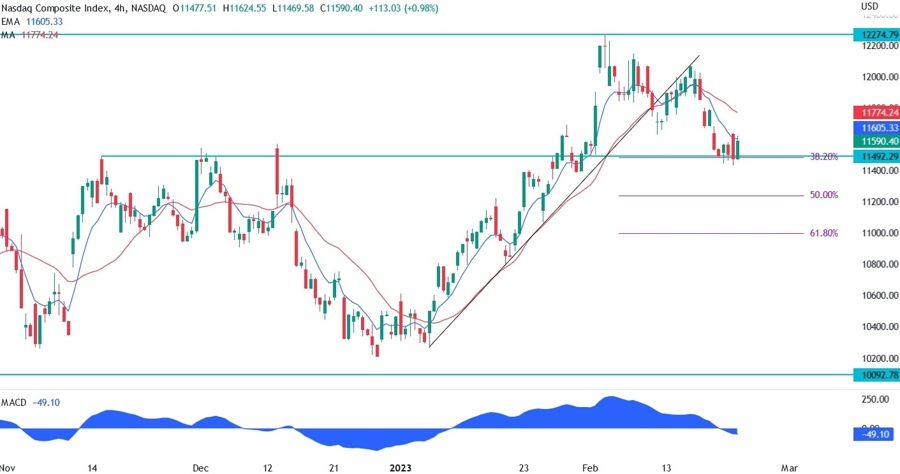
On the 4 hour chart below, we can see how the price is founding strong support at the 11492 level. We may see a little range here until new information comes in and gives the market the direction.
A clean break below will give the sellers more conviction to target possibly the 11000 level, with a further fall potentially leading to the 2022 low at 10092.
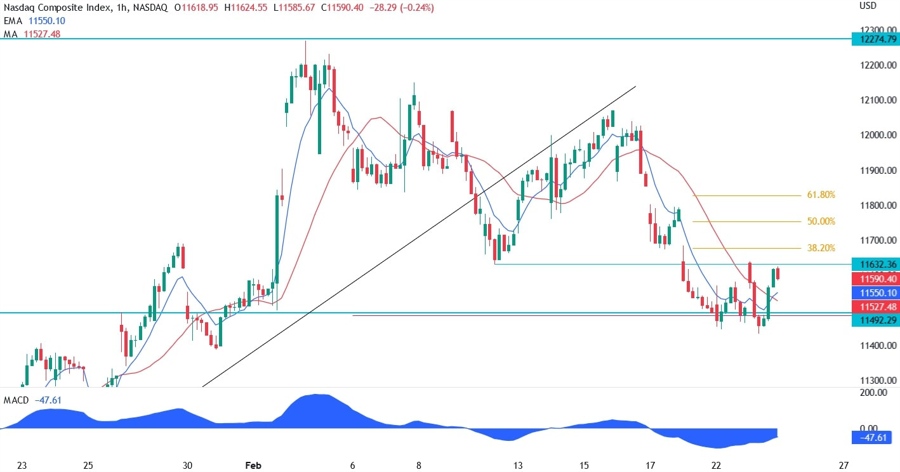
On the 1 hour chart below, we can see the little range between the 11632 resistance and the 11492 support. A break above the resistance and the 38.2% Fibonacci retracement level should give the buyers some conviction for an upside extension, possibly to the 61.8% retracement level.
The moving averages are crossing upwards, but it may be a false signal as it generally is within a range.