On the daily chart below, we can see that the price got rejected from the resistance at 12274 as the NFP report surprised everyone with very strong numbers. The market started to reprice a more hawkish Fed going forward and in fact the terminal rate is now above the Fed’s projections.
The CPI report came in line with expectations not giving too much in terms of surprises but the monthly rate is still too high. As we’ve been seeing in other markets, it’s been pure choppiness across the board as there’s lots of uncertainty on what’s next.
For now, the support at 11492 that has the 38.2% Fibonacci retracement level as confluence should be the target for the sellers. A break below would give the sellers even more conviction to target lower lows. For buyers that will be a good level to lean on.

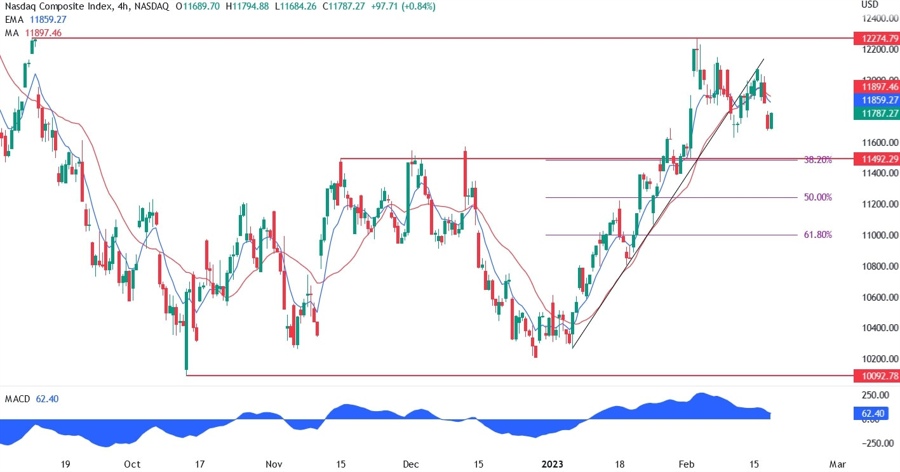
On the 4 hour chart below, we can see that the price has also broke out of a trendline that was supporting the uptrend. The price then pulled back to retest the trendline before going down again. What happens at the 11492 support will be key for the sentiment going forward.
A clear break below would give the market a bearish bias, on the other hand, a strong bounce should give the buyers some conviction to target again the resistance at 12274.
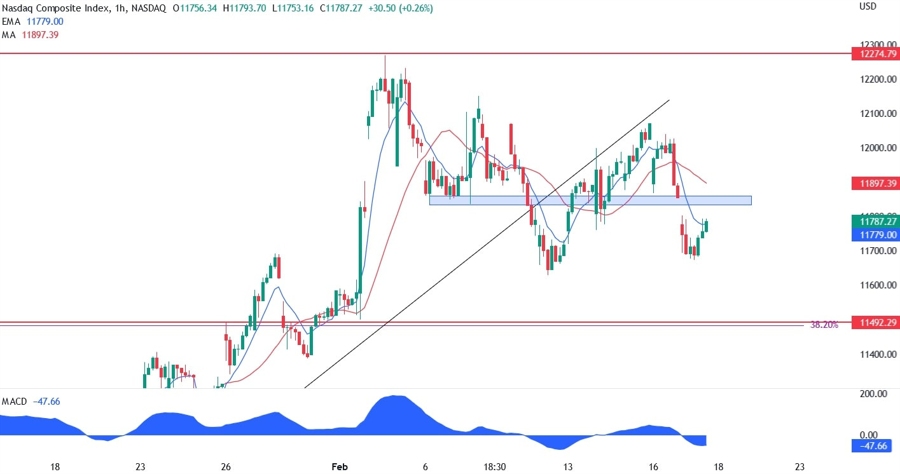
On the 1 hour chart below, we can see more closely the current ranging price action. The blue area at 11850 should act as a near term support within the range. A break above may see the price returning to the recent high at 12100. Sellers may lean on that area to target the support at 11492.