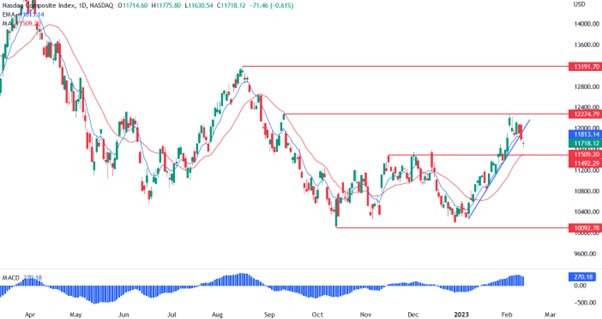
On the daily chart, we can see that the price couldn’t break out of the resistance at 12274. The price pulled back to the trendline support and then broke out. The likely support now is the previous strong resistance at 11492 and the red moving average. If the buyers fail to hold the line, the sellers should start to pile in as the price breaks lower. We probably won’t see much movement though ahead of the CPI report tomorrow as that will be key to decide where to go next.
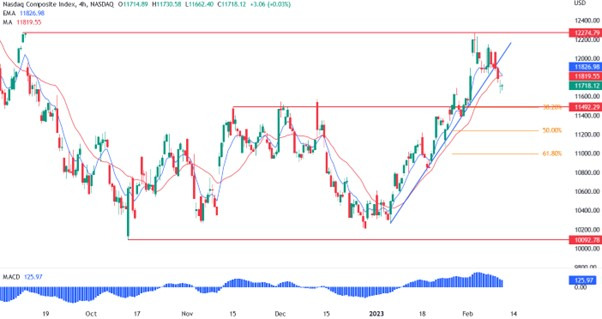
On the 4 hour chart, we can see more clearly the strong support at 11492. There’s also a 38.2% Fibonacci retracement level of the entire rally since January. That level will most likely define the next move or confirm it depending on the CPI result tomorrow. A beat on the expectations should see the price breaking lower and sellers getting the upper hand, on the other hand, a miss should give the buyers some conviction for a move higher targeting the 12274 resistance again.
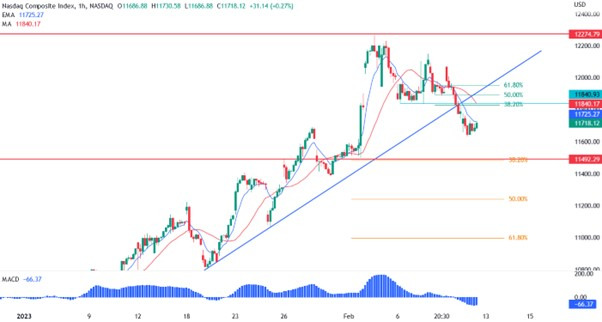
On the 1 hour chart, we can see the near term downward trend. Before the CPI we may see the price pulling back to the resistance at 11840, where there is also the 38.2% Fibonacci retracement level and the red moving average, and then moving lower towards the support at 11492. Today there isn’t much in terms of economic data, so the technicals should lead.