Fundamental Overview
Yesterday, gold managed to rally into a new all-time high despite some strong US data as Retail Sales and Jobless Claims beat expectations across the board.
In the bigger picture, gold remains in a bullish trend as real yields will likely continue to fall amid the Fed’s easing cycle. The pullbacks will likely be triggered by a repricing in rate cuts but unless the Fed’s reaction function changes, the uptrend should remain intact.
One key event which could trigger a strong selloff in gold is the upcoming US election. In fact, a Trump victory will likely raise real yields on higher growth and less rate cuts expectations.
Gold Technical Analysis – Daily Timeframe
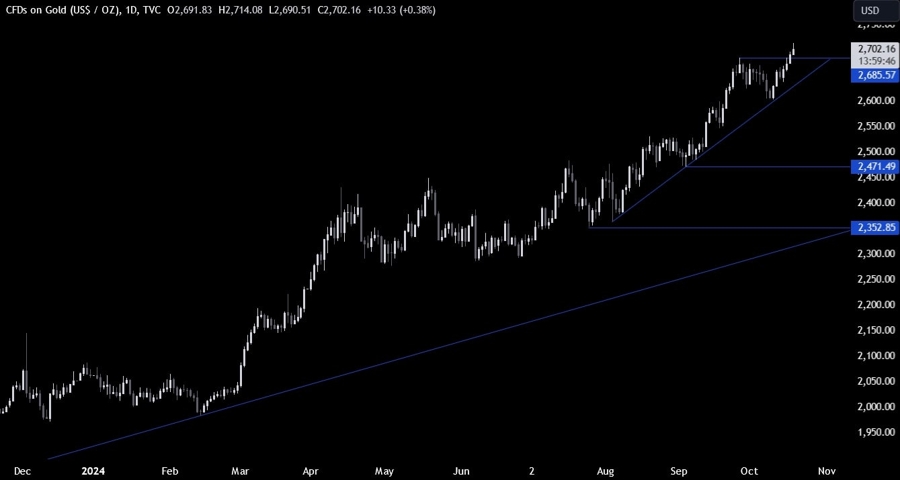
On the daily chart, we can see that gold managed to rally into a new all-time high. There’s not much we can glean from this timeframe but in case we get a pullback into the major trendline, the buyers will likely lean on it to position for new highs, while the sellers will look for a break lower to start targeting the 2500 level.
Gold Technical Analysis – 4 hour Timeframe
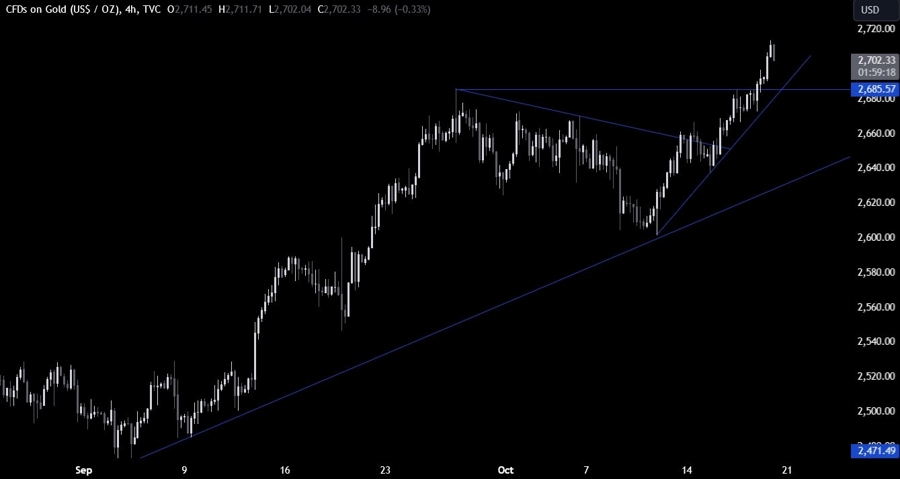
On the 4 hour chart, we can see that we a minor upward trendline defining the current bullish momentum. The buyers will likely keep on leaning on it to target new highs, while the sellers will look for a break lower to target a drop into the major trendline.
Gold Technical Analysis – 1 hour Timeframe
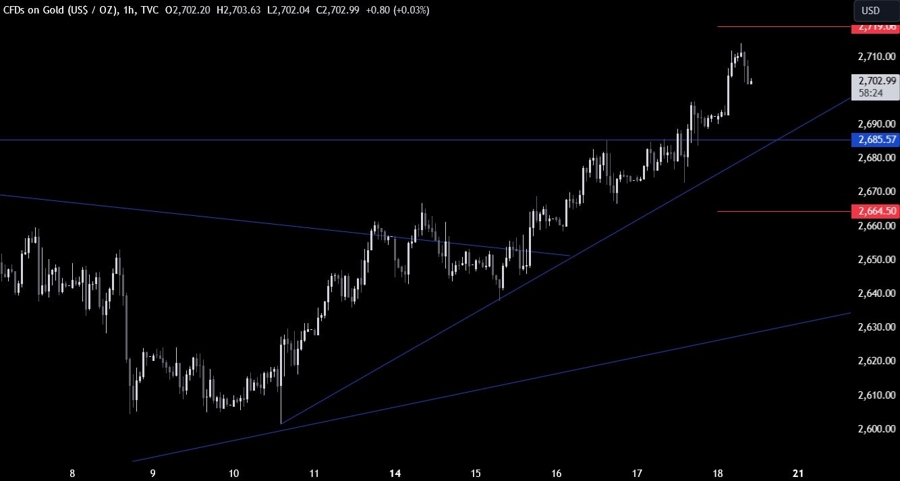
On the 1 hour chart, we can see that we now have a nice support zone around the previous all-time high as there’s also the confluence of the minor trendline. From a risk management perspective, the buyers will have a better risk to reward setup around the support to position for new highs.
The sellers, on the other hand, will look for a break lower to invalidate the bullish setup and position for a drop into the major trendline. The red lines define the average daily range for today.
