Fundamental Overview
After a brief divergence from real yields, gold caught up and extended the rally into a new all-time high helped by a benign FOMC decision. In fact, the Fed kept everything unchanged as expected and although Fed Chair Powell didn’t offer much in terms of forward guidance, he was optimistic on inflation and dismissed some worries.
That was what the market needed to catch up with falling real yields which topped with the last US inflation data. The trend remains bullish as long as inflation continues to ease. The biggest threat to gold is another hawkish repricing in interest rates expectations or a strong growth scare.
Gold Technical Analysis – Daily Timeframe
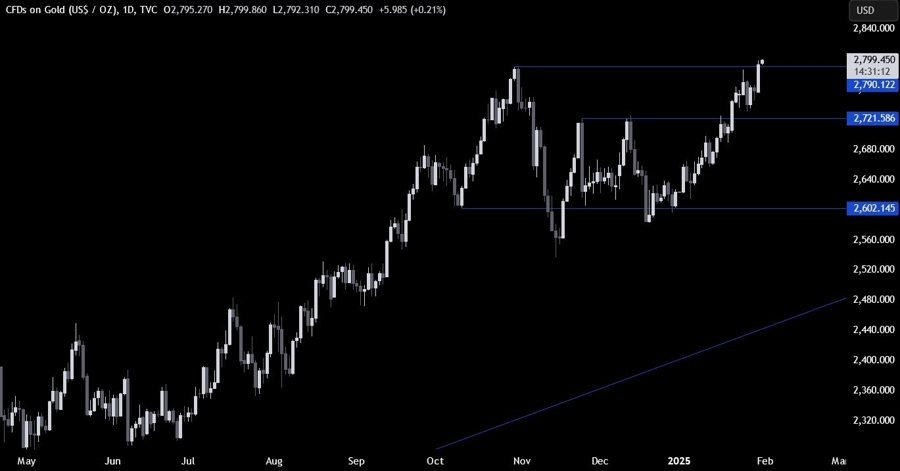
On the daily chart, we can see that gold finally managed to extend the rally into a new all-time high yesterday. The buyers will likely pile in around these levels to increase the bullish bets into new highs, while the sellers will look for a drop back below the 2790 level to position for a pullback into the 2721 level next.
Gold Technical Analysis – 4 hour Timeframe
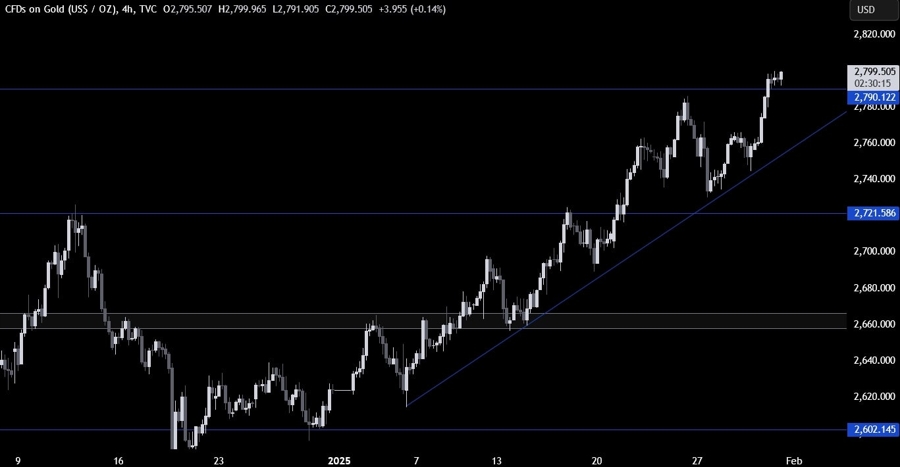
On the 4 hour chart, we can see that we have an upward trendline defining the bullish momentum. The buyers will likely continue to lean on it to keep pushing into new highs, while the sellers will look for a break below it to increase the bearish bets into new lows.
Gold Technical Analysis – 1 hour Timeframe
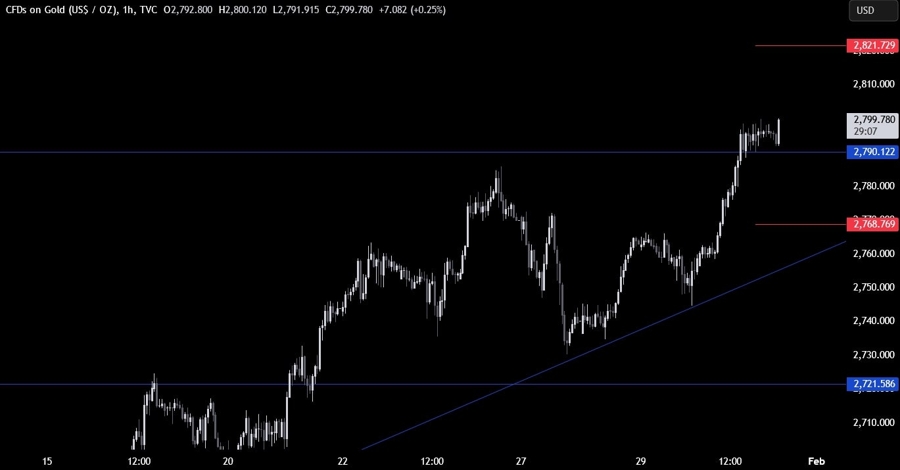
On the 1 hour chart, we can see that we have a little consolidation just above the all-time high. This is where we expect the buyers to pile in with a defined risk below the 2790 level, while the sellers will look for a drop below the level to target a pullback into the trendline. The red lines define the average daily range for today.
Upcoming Catalysts
Today we conclude the week with the US PCE and the US Employment Cost Index.
