Fundamental Overview
Gold continued to print new all-time highs day after day this week as the fall in real yields and later the US dollar gave the precious metal a tailwind to push into new highs. The most recent rise though has been quite parabolic and that’s often followed by a deeper pullback.
We have the US NFP report tomorrow and we might see some profit taking ahead of the release. The labour market data throughout January has been strong, so we might get a strong NFP which could weigh on gold in the short term and offer a dip-buying opportunity at better levels.
Gold Technical Analysis – Daily Timeframe
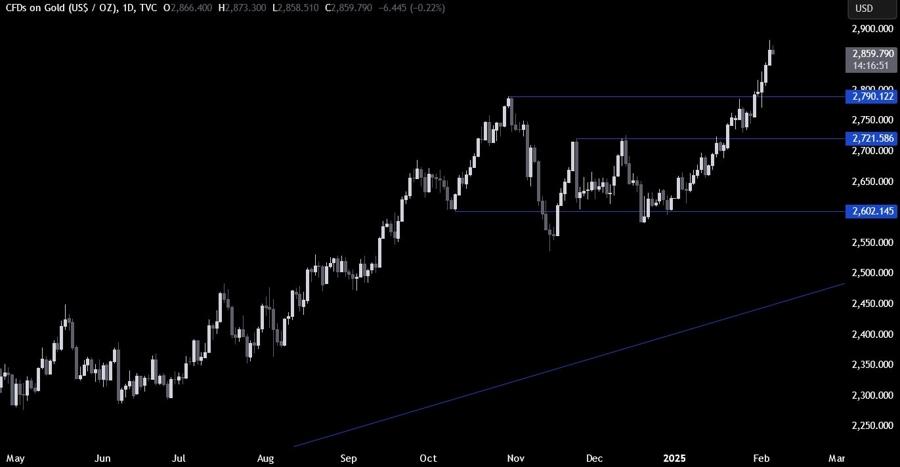
On the daily chart, we can see that gold extended the rally into new all-time highs yesterday. From a risk management perspective, the buyers will have a better risk to reward setup around the 2790 level. The sellers, on the other hand, will want to see the price breaking below that level to increase the bearish bets into the 2600 level next.
Gold Technical Analysis – 4 hour Timeframe
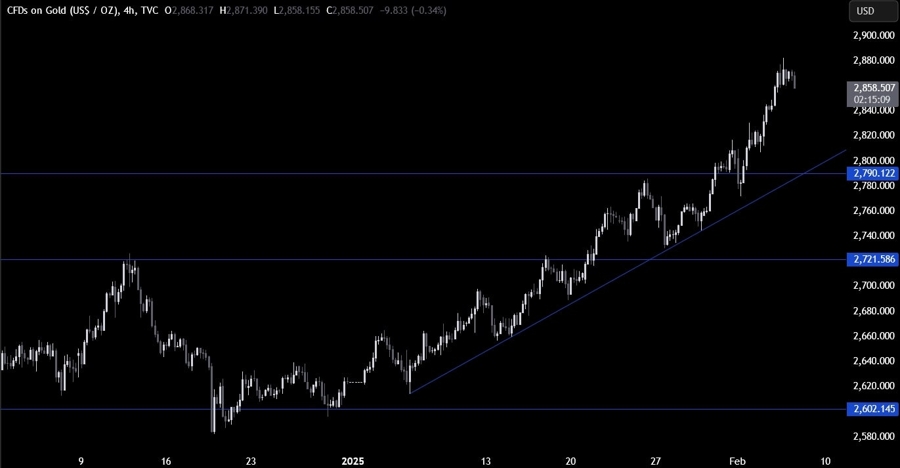
On the 4 hour chart, we can see that the price has been following well the upward trendline but more recently the momentum picked up strongly turning it into a parabolic rise. We can often see deeper pullbacks after such price action.
The buyers will likely lean on the trendline again with the 2790 level for confluence, while the sellers will look for a break lower to gain more conviction and increase the bearish bets into new lows.
Gold Technical Analysis – 1 hour Timeframe
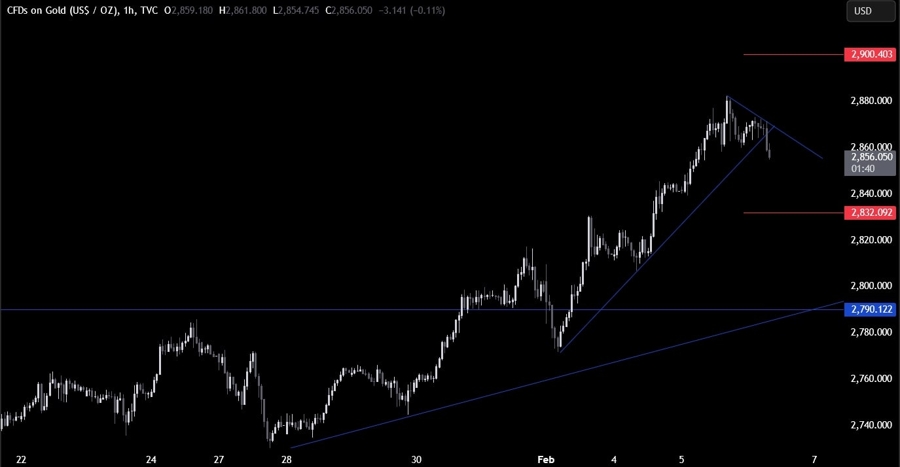
On the 1 hour chart, we can see that we broke below a minor upward trendline that was defining the bullish momentum on this timeframe. The sellers will likely pile in here to position for the pullback into the 2790 level. The buyers, on the other hand, will want to see the price breaking above the downward counter-trendline to position for new highs. The red lines define the average daily range for today.
Upcoming Catalysts
Today we get the latest US Jobless Claims figures, while tomorrow we conclude the week with the US NFP report.
