Fundamental Overview
Gold surged into a new all-time high today after a strong run that started on Friday. There was no meaningful catalyst for the latest surge which might indicate that it was just a technical squeeze. Nevertheless, real yields have been falling steadily since Powell’s dovish tilt, so that provided a tailwind for higher gold prices.
The focus is now on the US labour market data that will culminate with the NFP report on Friday. Strong data might take the probability for a September cut towards a 50/50 chance but will certainly see a more hawkish repricing further down the curve and could weigh on gold. Soft data, on the other hand, will likely see traders increasing the dovish bets giving gold another boost.
In the bigger picture, gold should remain in an uptrend as real yields will likely continue to fall amid Fed easing given their dovish reaction function. In the short-term though, hawkish repricing in interest rates expectations will likely keep on triggering corrections.
Gold Technical Analysis – Daily Timeframe
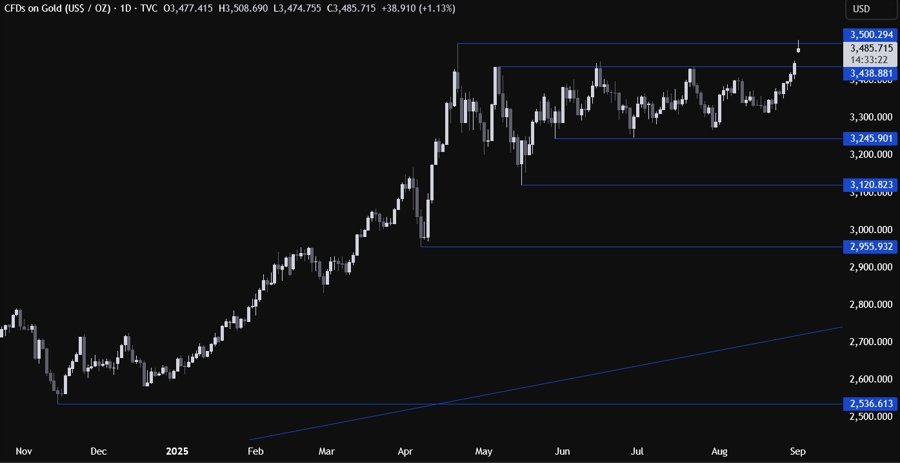
On the daily chart, we can see that gold eventually broke out of the 4-month long range and rallied all the way up to a new all-time high. This is where we can expect the sellers to step in with a defined risk above the high to position for a drop back into the 3,245 support. The buyers, on the other hand, will look for a break higher to increase the bullish bets into new highs.
Gold Technical Analysis – 4 hour Timeframe

On the 4 hour chart, we can see that we have an upward trendline defining the bullish momentum. If we get a pullback into the trendline, we can expect the buyers to lean on it with a defined risk below it to keep pushing into new highs. The sellers, on the other hand, will look for a break lower to increase the bearish bets into the 3,245 support next.
Gold Technical Analysis – 1 hour Timeframe
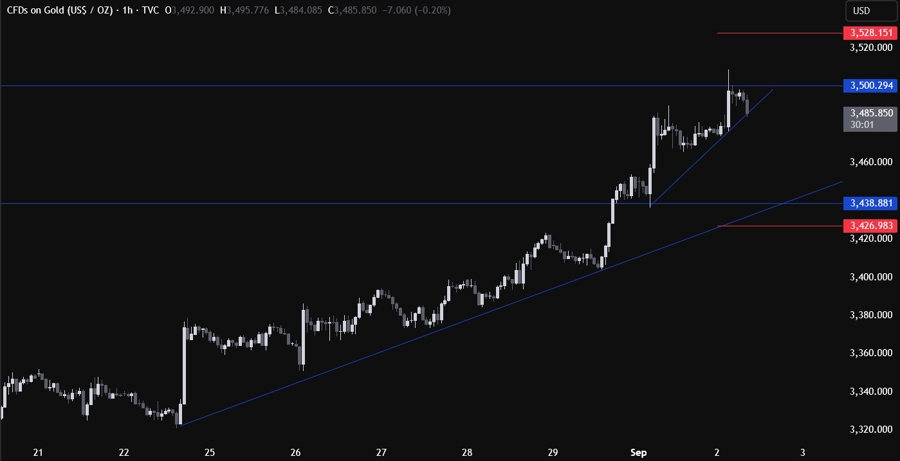
On the 1 hour chart, we can see that we have a minor upward trendline acting as support. The buyers will likely keep on leaning on it to push into new highs, while the sellers will look for a break lower to target the pullback into the next trendline around the 3,438 level. The red lines define the average daily range for today.
Upcoming Catalysts
Today we get the US ISM Manufacturing PMI. Tomorrow, we have the US Job Openings data. On Thursday, we get the US ADP, the latest US Jobless Claims figures and the US ISM Services PMI. On Friday, we conclude the week with the US NFP report.
