Fundamental Overview
Gold came under some pressure on Friday despite the lack of bearish catalysts. Maybe, the positive risk sentiment triggered some profit-taking but overall, the picture hasn’t changed.
The parabolic surge is certainly making some people nervous but given the lack of bearish catalysts, there’s not much to challenge the momentum.
The US-China drama remains a key market focus but the market is now more certain on some kind of deal. The main risk event this week could be the US CPI on Friday. Although the Fed is more focused on the labour market now, an upside surprise in inflation could still trigger a hawkish repricing in expectations.
In the bigger picture, gold should remain in an uptrend as real yields will likely continue to fall amid the Fed’s dovish reaction function. But in the short term, a hawkish repricing in interest rate expectations could trigger a correction.
Gold Technical Analysis – Daily Timeframe
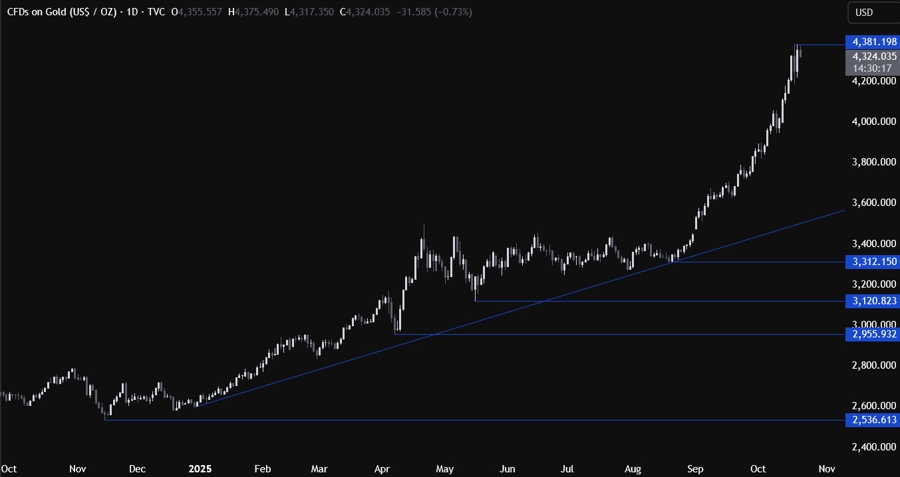
On the daily chart, we can see that gold managed to recover Friday’s losses and extend into yet another all-time high before pulling back a bit. The lack of bearish catalysts continues to keep the bullish momentum intact. This rally went so much parabolic that it’s basically useless to look at the daily timeframe at the moment, so we need to zoom in to see some more details.
Gold Technical Analysis – 4 hour Timeframe
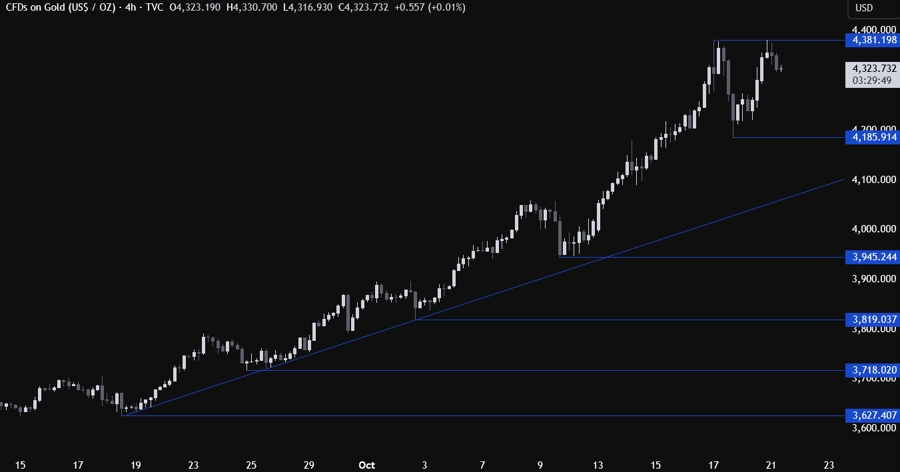
On the 4 hour chart, we can see that the price yesterday couldn’t sustain the breakout above the Friday’s high. This might turn out to be a double top in a bigger correction, so we can expect the sellers to step in around the highs to position for a pullback into the major trendline and increase the bearish bets on a break below the 4,185 level. The buyers, on the other hand, will want to see the price breaking higher to invalidate the bearish setup and pile in for a rally into new highs.
Gold Technical Analysis – 1 hour Timeframe
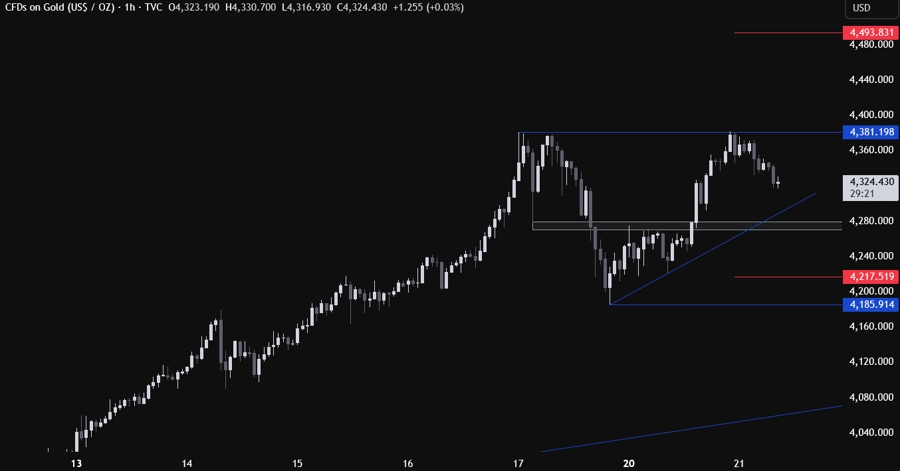
On the 1 hour chart, we can see that we have a minor support zone around the 4,280 level where we can also find a minor upward trendline. That’s where we can expect the buyers to step in with a defined risk below the support to position for a rally into new all-time highs. The sellers, on the other hand, will want to see the price breaking lower to increase the bearish bets into the major trendline. The red lines define the average daily range for today.
Upcoming Catalysts
The focus remains on the US-China developments but on Friday we will also get the US CPI report and the US flash PMIs.
