Fundamental Overview
The US PMIs yesterday came out much better than expected sending Treasury yields and the US Dollar higher. Higher real yields raise the opportunity cost of holding gold, so there’s generally an inverse correlation between the two. In fact, we saw gold prices falling following the data release and at the moment there’s no strong reason to buy the dip as the markets question if there will be rate cuts at all this year.
Gold Technical Analysis – Daily Timeframe
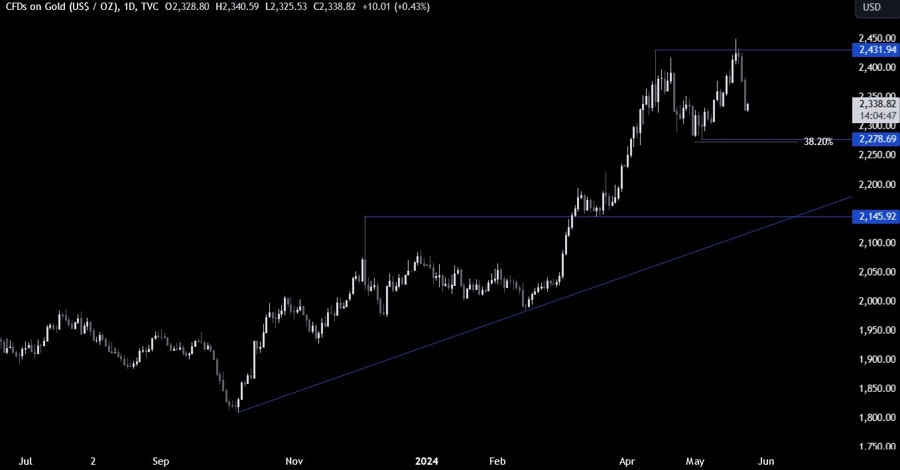
On the daily chart, we can see that gold has been on a free fall since setting the new all-time high at 2450. There’s a good support zone around the 2278 level where we can also find the 38.2% Fibonacci retracement level for confluence.
That’s where we can expect the buyers to step in with a defined risk below the support to position for a rally into a new all-time high. The sellers, on the other hand, will want to see the price breaking lower to increase the bearish bets into the trendline around the 2150 level.
Gold Technical Analysis – 1 hour Timeframe
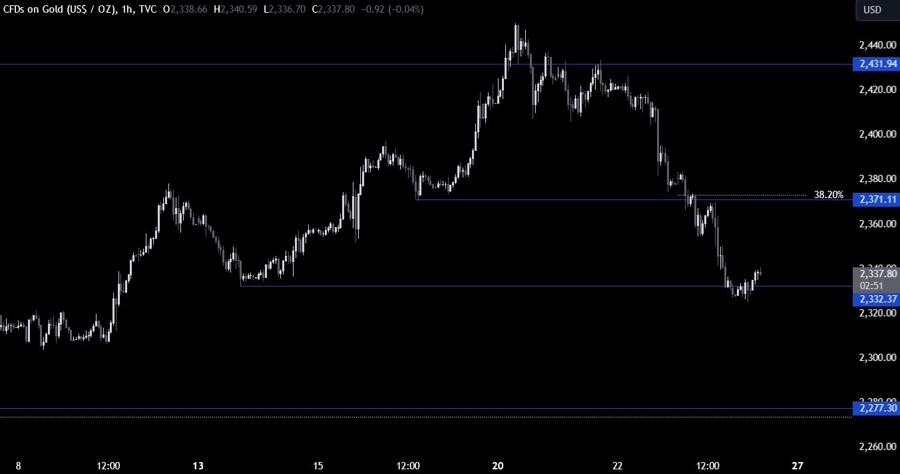
On the 1 hour chart, we can see that we have a good resistance around the 2371 level where there’s the 38.2% Fibonacci retracement level for confluence. That’s where we can expect the sellers to step in with a defined risk above the resistance to position for a break below the 2278 support with a better risk to reward setup.
Alternatively, if the bearish momentum from the US PMIs remains strong, the sellers will likely increase the bearish bets as soon as we break below the recent low at 2330. The buyers, on the other hand, will likely buy the dip at these levels and will want to see the price breaking above the 2371 resistance to invalidate the bearish setup and position for a rally into a new all-time high.
Upcoming Catalysts
There are no catalysts today so the market will likely trade based on yesterday's US PMIs data.
