The big miss in the US ISM Manufacturing PMI triggered an incredible rally in Gold as real yields started to fall amid weaker US data. As previously mentioned, Gold should be supported in the big picture heading into the easing cycle, but in the short-term strong US data could weigh on it because it would make the market to price out rate cuts and lift the real yields. Since the data started to come out weaker than expected, it caused a stronger reaction because it was in line with the big picture fundamentals. Today, we have the US NFP on the agenda where a hot report will likely send Gold quickly lower while a weak release should give it another boost.
Gold Technical Analysis – Daily Timeframe
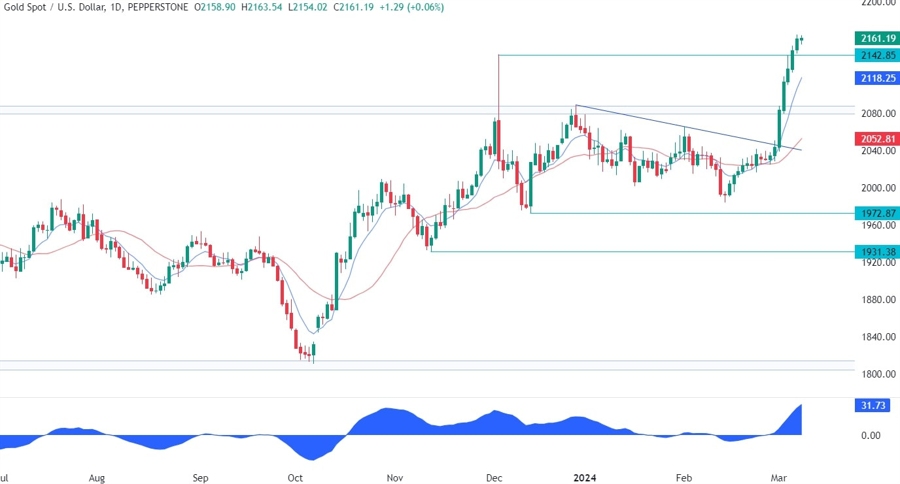
On the daily chart, we can see that Gold broke through the trendline and surged to a new all-time high following a set of weaker than expected US data. No resistance could stop this rally as the FOMO kicked in and the sellers got squeezed hard. The price is now a bit overstretched though as depicted by the distance from the blue 8 moving average. In such instances, we can generally see a pullback into the moving average or some consolidation before the next move.
Gold Technical Analysis – 4 hour Timeframe
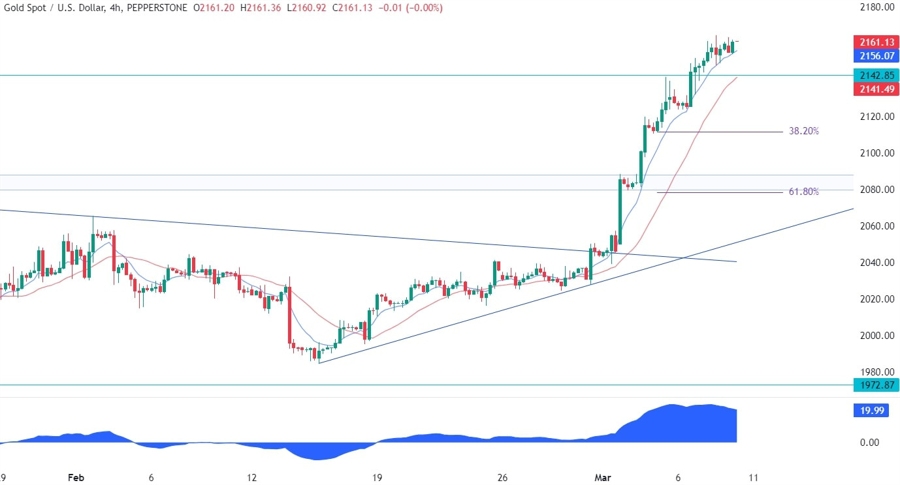
On the 4 hour chart, we can see that from a risk management perspective, the buyers will have much better risk to reward setups around the 38.2% Fibonacci retracement level where they will also find the confluence with the daily 8 moving average, and the 61.8% Fibonacci retracement level around the previous resistance now turned support at 2080. The sellers, on the other hand, will likely pile in at every break lower.
Gold Technical Analysis – 1 hour Timeframe
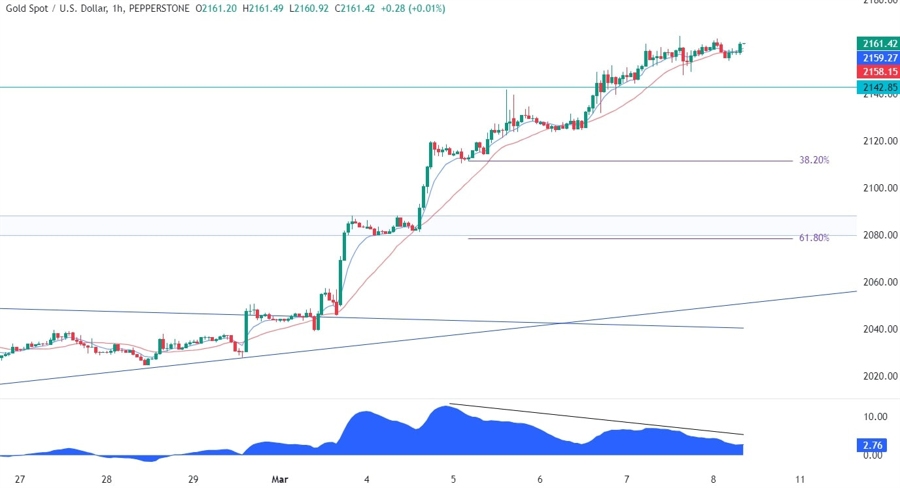
On the 1 hour chart, we can see that the price has been diverging with the MACD for a few days. This is generally a sign of weakening momentum often followed by pullbacks or reversals. In this case, it should signal at least a pullback from these levels although the economic data can easily invalidate everything. The buyers might want to split their orders as the price can bounce from either Fibonacci level. The sellers, on the other hand, will want to see the price breaking every support level to keep piling in and target new lows.


