We got an incredibly strong rally in Gold last Friday following the big miss in the US ISM Manufacturing PMI. As previously mentioned, Gold should be supported in the big picture heading into the easing cycle, but in the short-term strong US data could weigh on it because it would make the market to price out rate cuts and lift the real yields and the US Dollar. This time, the data surprised to the downside and since it’s line with the big picture fundamentals, it caused a much bigger reaction sending Gold to new highs. Watch out for the data this week as we have lots of reports that could reverse the move.
Gold Technical Analysis – Daily Timeframe

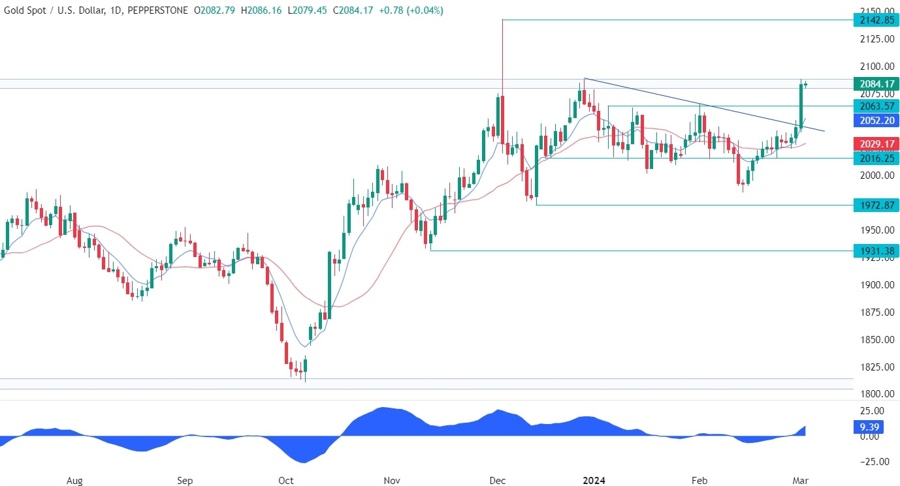
On the daily chart, we can see that Gold broke through the trendline and surged into the 2080 resistance following the weaker than expected US ISM Manufacturing PMI. This is where the sellers are likely to step in with a defined risk above the level to position for a drop into the broken trendline. The buyers, on the other hand, will want to see the price breaking higher to increase the bullish bets into the all-time high.
Gold Technical Analysis – 4 hour Timeframe

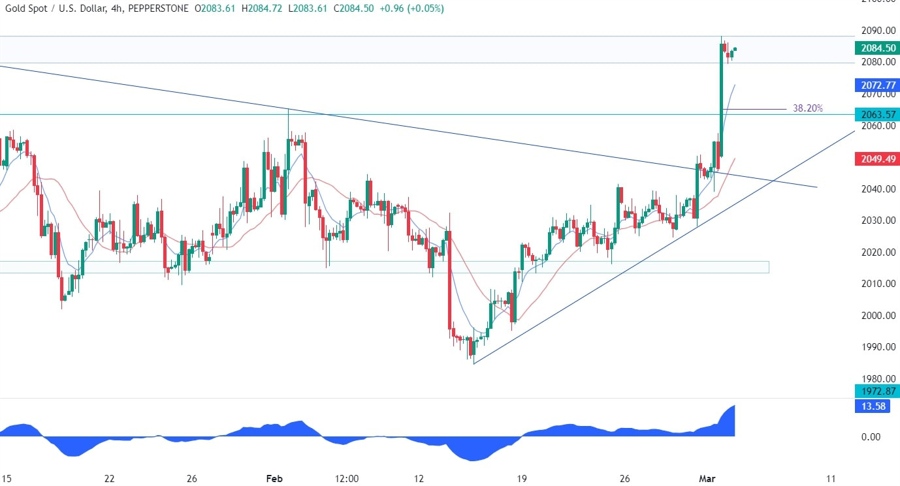
On the 4 hour chart, we can see more closely the incredibly strong rally following the US data. We can see that we have a good support level around the previous resistance at 2063 where we can also find the 38.2% Fibonacci retracement level for confluence. This will be the first target for the sellers shorting from the 2080 resistance. The buyers, on the other hand, will likely step in around this support level with a defined risk below it to position for another rally into new highs.
Gold Technical Analysis – 1 hour Timeframe

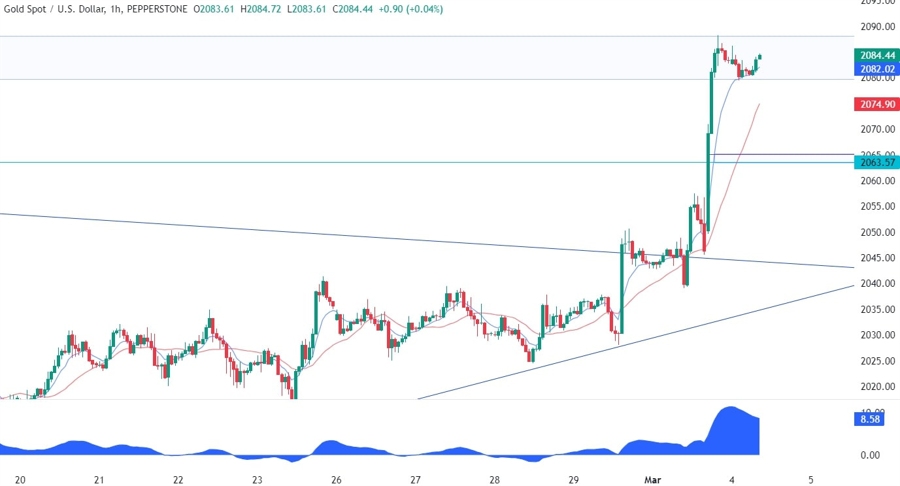
On the 1 hour chart, we can see more closely the recent price action with the price now trading right at the key resistance zone. From a risk management perspective, it’s pretty clear that the buyers will have much better risk to reward setups around the 2063 level and the major upward trendline around the 2050 level. Nevertheless, the bullish momentum could keep going if the US data this week disappoints further.
Upcoming Events
This week we have lots of important events on the agenda with the release of the US labour market data and the Fed Chair Powell testifying to Congress. We begin tomorrow with the US ISM Services PMI. On Wednesday, we have the US ADP, the US Job Openings and the Fed Chair Powell speaking. On Thursday, we get the latest US Jobless Claims figures, while on Friday we conclude the week with the US NFP report. Strong data is likely to weigh on Gold while weak figures should give it a boost.
