Gold eventually erased all the losses from the hot US CPI report with the price continuing to rally amid lack of new bearish catalysts. It looks like the market is now fine with the three rate cuts priced in for the year, which is in line with what the Fed expected in the December Dot Plot. Since the Fed is not expected to restart the tightening cycle, Gold should remain supported as we head into the easing cycle, but in the short term we might see some selling if the data comes out too strong as that would make the market to price out even the remaining three rate cuts.
Gold Technical Analysis – Daily Timeframe
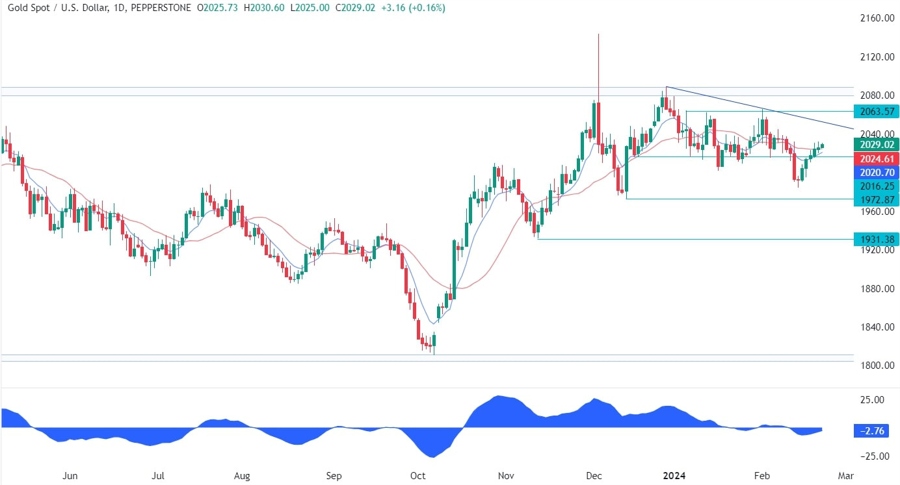
On the daily chart, we can see that Gold rallied back above the key 2015 resistance and extended the rally into the 2030 level. The target for the buyers should be the next resistance around the 2063 level, but before that they will likely find the sellers at the trendline.
Gold Technical Analysis – 4 hour Timeframe
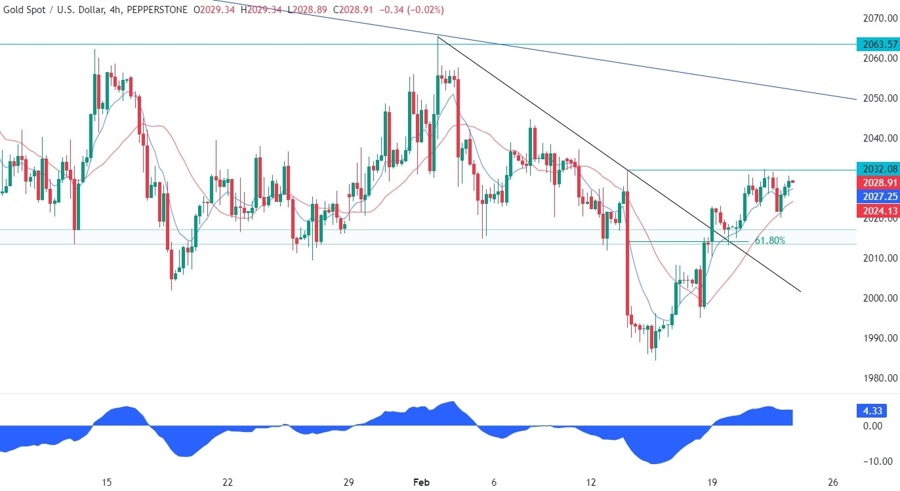
On the 4 hour chart, we can see that we had a strong resistance zone around the 2015 level where we had the confluence with the trendline and the 61.8% Fibonacci retracement level. The buyers piled in on the breakout and on the retest to target the 2063 resistance. The sellers, on the other hand, will now lean on the 2032 level which is the high of the US CPI release.
Gold Technical Analysis – 1 hour Timeframe
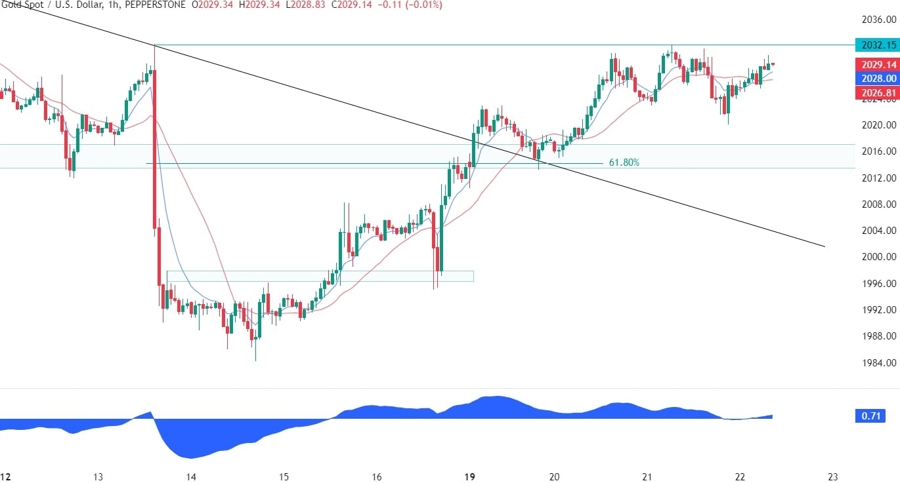
On the 1 hour chart, we can see more closely the recent price action with some consolidation around the 2032 level as the sellers continue to pile in while the buyers keep on pushing for a breakout. If we do get a selloff from this level, we can expect the buyers to step in again around the 2015 support, while the sellers will want to see the price breaking further below the support to increase the bearish bets into new lows.
Upcoming Events
Today we will see the latest US Jobless Claims figures and the US PMIs which will likely be big market movers. Strong data is likely to weigh on Gold while weak figures should give it a boost.
See the video below
