Last Friday, Gold sold off following a surprisingly strong NFP report. The headline number was much higher than even the most optimistic estimates and the unemployment rate ticked lower. There were also some bad things though like the plunge in Average Weekly Hours which contributed to push higher Average Hourly Earnings, and the Household survey showing job losses for the second consecutive month.
In fact, even Fed’s Goolsbee mentioned this detail saying that “despite the brisk hiring numbers, weakness in overall hours worked suggests that this wasn’t as strong as that headline number suggested”. There are big seasonal adjustments in January and the data might have been distorted a bit which makes trusting this report a little harder.
Gold Technical Analysis – Daily Timeframe
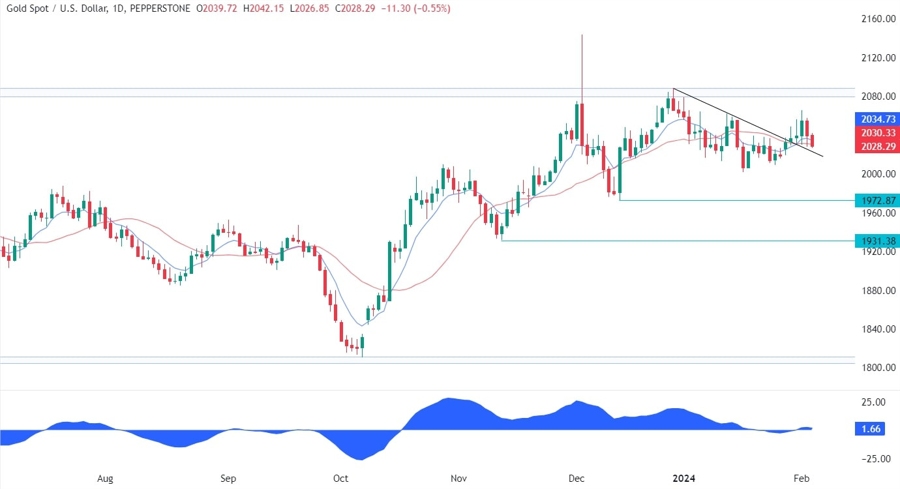
On the daily chart, we can see that Gold dropped last Friday following the strong NFP report and continued to fall in the Asian session today. Technically, the break above the trendline should be bullish, but things might get complicated if the price falls back below it as it could end up in a fakeout, which is generally a reversal signal. We need to zoom in to get a better picture and see some more details.
Gold Technical Analysis – 4 hour Timeframe
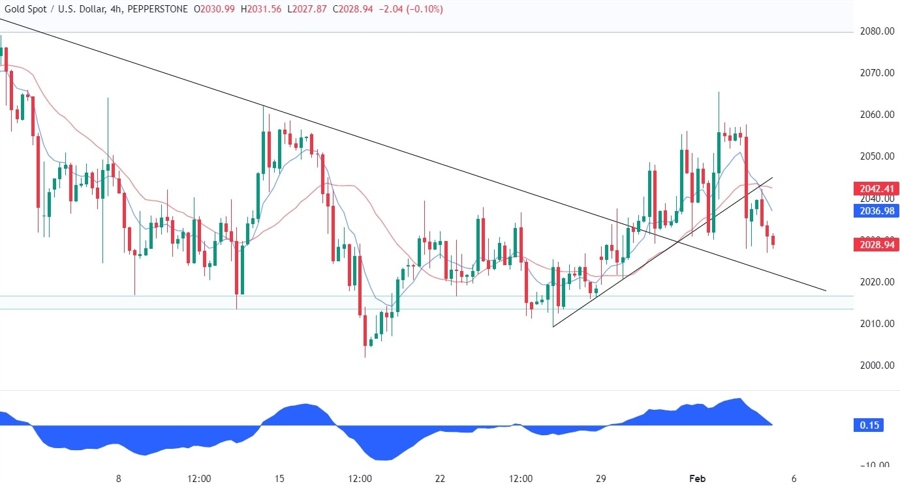
On the 4 hour chart, we can see that the price broke below the upward trendline following the NFP release, retested it and continued lower. The sellers should now be targeting the key support around the 2015 level and looking for a breakout to the downside. The buyers, on the other hand, should step in around the support as they will have a much better risk to reward setup to position for a rally into the 2080 resistance.
Gold Technical Analysis – 1 hour Timeframe
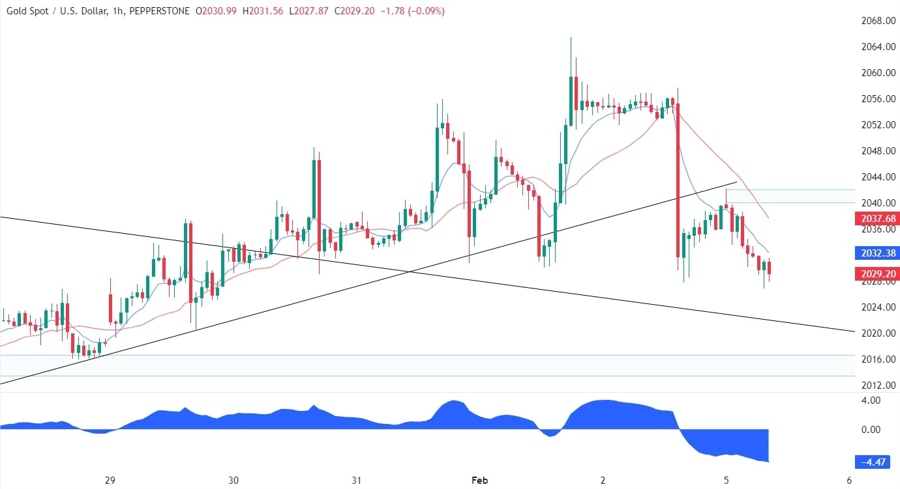
On the 1 hour chart, we can see that there’s not much to do here other than waiting for the price to reach or break the key levels. The resistance zone around the 2040 level will be crucial as a break above it should invalidate the bearish bias and take us to new highs.
Upcoming Events
This week is basically empty on the data front with just a couple of key economic releases. Today we have the US ISM Services PMI where the market will likely focus on the employment index given the big drop last month. On Thursday, we will see the latest US Jobless Claims figures where the market will want to see if the resilience in the labour market remains intact. Strong data is likely to keep on weighing on Gold while weak figures should give it a boost.
See the video below
