Gold continues to remain under pressure as strong economic data is lifting real yields and giving a boost to the US Dollar. The market doesn’t see a rate cut in March anymore, although that can change quickly if the data starts to weaken in February. We will need more strong data though to price out even the rate cuts from May onwards and that will weigh on Gold even more, so watch out for strength in the data in the next weeks.
Gold Technical Analysis – Daily Timeframe
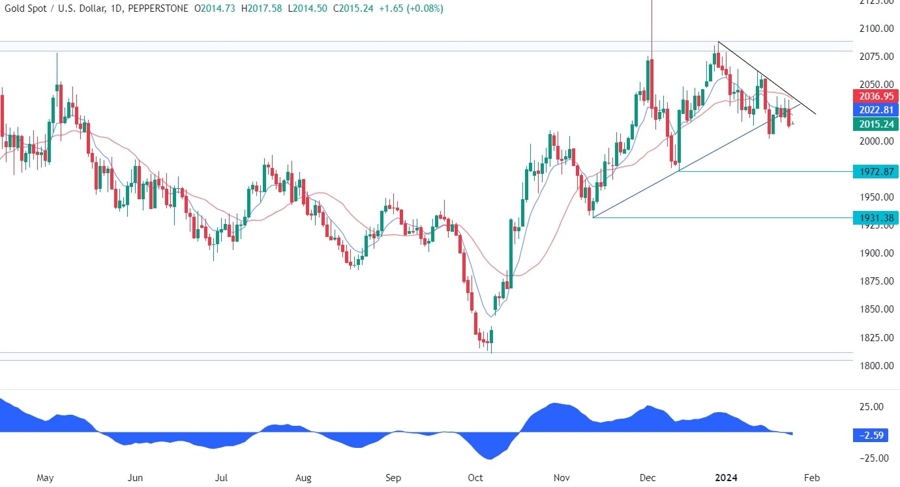
On the daily chart, we can see that Gold retraced almost all the way back to the downward trendline but got rejected multiple times from the red 21 moving average and eventually dropped below the upward trendline again. The sellers stepped in around the moving average to position for a fall into the 1972 level, but the buyers keep on fighting strongly to avoid a complete breakdown.
Gold Technical Analysis – 4 hour Timeframe
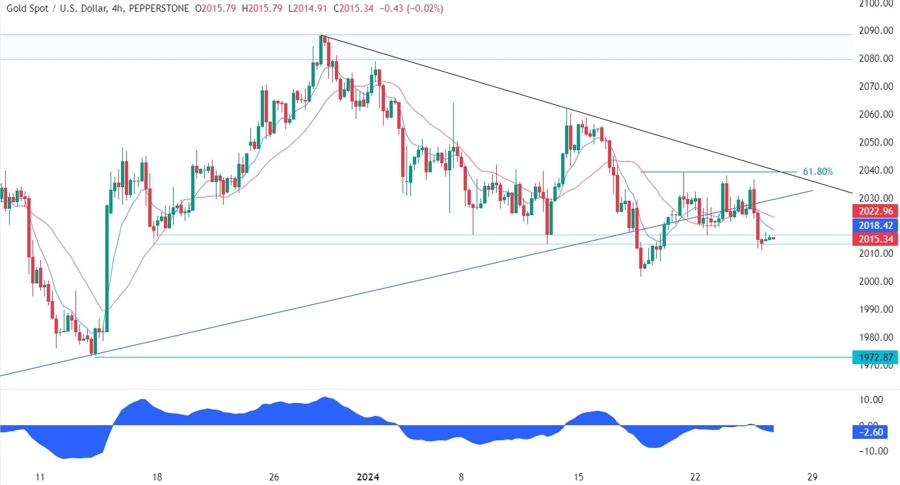
On the 4 hour chart, we can see that the price is now testing the key support zone around the 2015 level again. This is where the buyers are likely to step in with a defined risk below the level to position for a rally back into the downward trendline. The sellers, on the other hand, will want to see the price breaking lower to increase the bearish bets into the 1972 level.
Gold Technical Analysis – 1 hour Timeframe
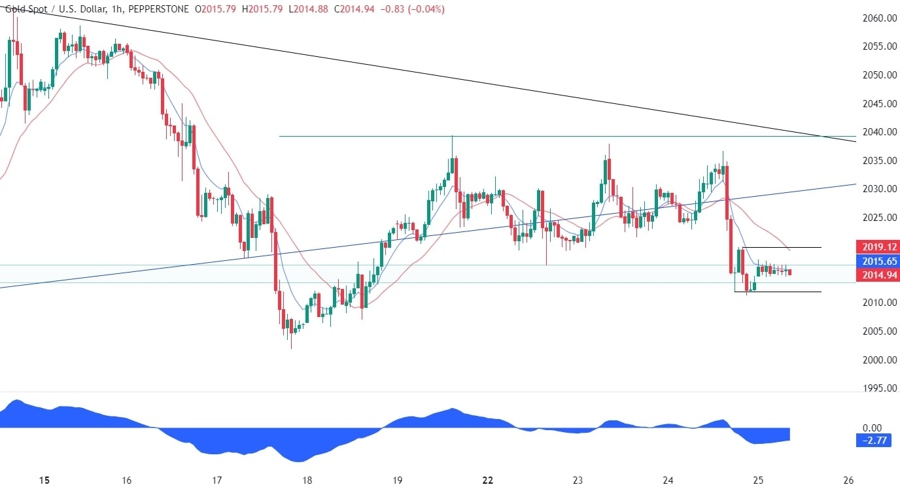
On the 1 hour chart, we can see more closely the recent price action and we can notice that Gold is now consolidating at the support zone. This formation gives us a clear setup with two possible scenarios:
- If the price breaks above the recent lower high at 2020, then we can expect a rally into the downward trendline.
- If the price breaks below the recent lower low at 2011, then we will likely see a continuation of the drop and the 1972 level next.
Upcoming Events
Today we will see the Advance US Q4 GDP and the latest US Jobless Claims figures. Tomorrow, we conclude the week with the US PCE report.Strong data is likely to weigh on Gold while weak figures should support the market.
See the video below

