Gold got stuck in a consolidation recently as the market has been waiting for the US CPI release scheduled for today. In the big picture, Gold should remain supported as we get closer to the rate cut cycle. Moreover, even if the CPI data comes in hot, the figures should start to look much better in Q2 since the high readings from Q1 2023 will be excluded from the calculation. The hard part is blending the short-term direction with the long-term one, and for that we can get some help from technical analysis.
Gold Technical Analysis – Daily Timeframe

On the daily chart, we can see that Gold recently has been consolidating around a key support zone around the 2020 level where we can also find the confluence with the trendline and the 61.8% Fibonacci retracement level. This is where the buyers have been piling in with a defined risk below the trendline to position for a rally into a new all-time high. The sellers, on the other hand, will want to see the price breaking lower to invalidate the bullish setup and position for a drop into the 1970 level.
Gold Technical Analysis – 4 hour Timeframe
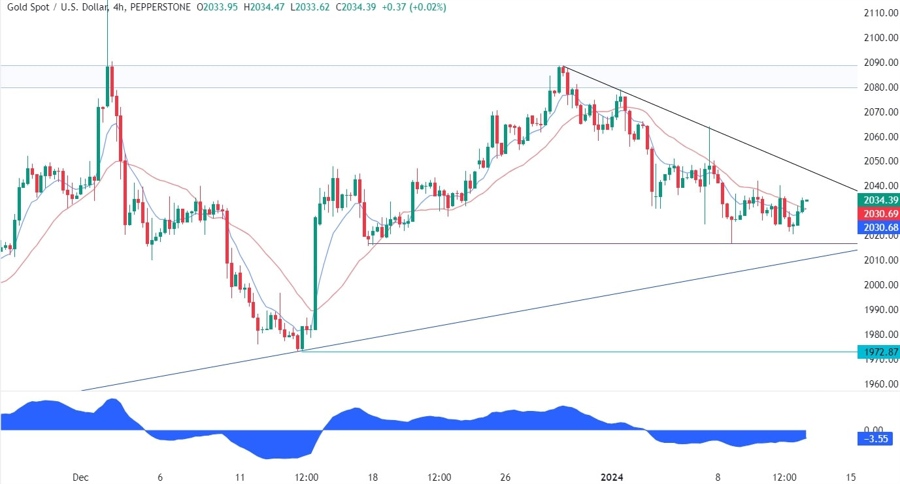
On the 4 hour chart, we can see that we have a downward trendline defining the current short term downtrend. The sellers are likely to lean on the trendline with a defined risk above it to position for a break below the major upward trendline. The buyers, on the other hand, will want to see the price breaking higher to invalidate the bearish setup and increase the bullish bets into the all-time high.
Gold Technical Analysis – 1 hour Timeframe
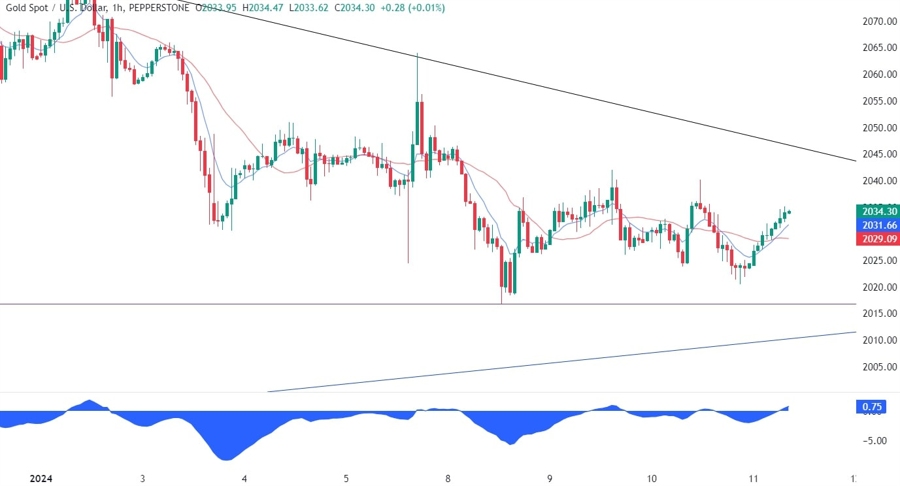
On the 1 hour chart, we can see more closely the recent price action with Gold trading between the 2020 support and the 2040 resistance. There’s not much to do here other than waiting for the key levels and setups to work out. Watch out for the data today as we will likely see big moves afterwards.
Upcoming Events
Today we will get the latest US CPI report and the US Jobless Claims figures. Strong data is likely to weigh on Gold while weak figures should give it a boost.
See the video below
