Last Friday, Gold spiked on both sides after the release of two key economic reports. The US NFP report beat expectations, with the market initially trimming rate cuts expectations and spiking downwards, but after a couple of minutes, the price reversed as under the hood the data wasn’t as good as it seemed. Sometime later, we got the release of the ISM Services PMI and that’s where the real shocker came from.
Besides the data missing across the board, the employment sub-index cratered to levels seen only in the dot-com recession, the global financial crisis and the covid recession. This gave a boost to Gold but in a strange move, the price reversed soon after and finished the day lower. In the big picture, the price should keep on trending higher as long as the market continues to price in more and more rate cuts.
Gold Technical Analysis – Daily Timeframe
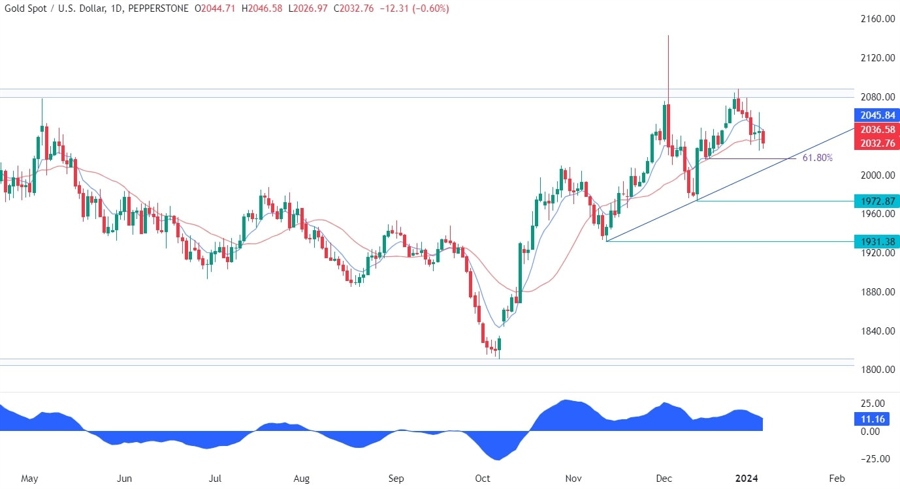
On the daily chart, we can see that Gold has been falling steadily from the 2080 resistance following stronger US data releases. Last Friday we got two weak reports, but the price has not reversed the selloff. From a risk management perspective, the buyers will have a good risk to reward setup around the trendline where they will also find the 61.8% Fibonacci retracement level for confluence. The sellers, on the other hand, will want to see the price breaking lower to invalidate the bullish setup and extend the drop into the 1972 level.
Gold Technical Analysis – 4 hour Timeframe
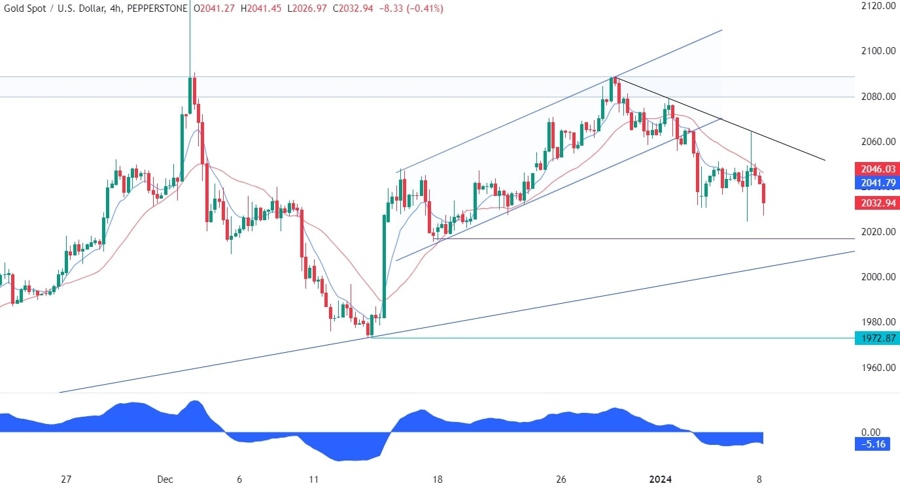
On the 4 hour chart, we can see more clearly the downward spike on the NFP report and the upward spike on the ISM Services PMI release. The sellers leant on the downward trendline to position for a drop into the major upward trendline around the 2010 level. The buyers will need the price to break above the downward trendline to confirm the restart of the uptrend and position for new highs.
Gold Technical Analysis – 1 hour Timeframe
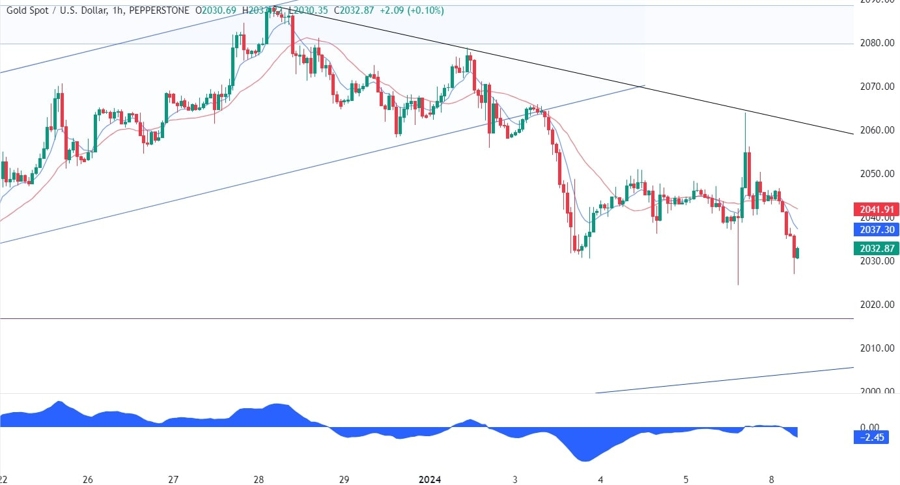
On the 1 hour chart, we can see that the recent price action has been pretty messy and overall rangebound. There’s no clear level where to lean on except the 61.8% Fibonacci retracement level, the major upward trendline and the downward trendline. The buyers might want to split their position in half and lean both on the Fibonacci level and the upward trendline. The sellers, on the other hand, should wait for another pullback into the downward trendline before taking new short positions.
Upcoming Events
This week is basically empty on the data front with the only two notable releases scheduled for Thursday when we will get the US CPI report and the US Jobless Claims figures. Strong data is likely to weigh on Gold while weak figures should give it a boost.
See the video below
