Fundamental Overview
Gold showed impressive resilience yesterday despite major headwinds coming from strong US data, higher yields and surging US dollar. On a day like that, you would expect gold to make a decent pullback, but that wasn’t the case at all.
Nevertheless, the upside looks limited at the moment because of the hawkish repricing in interest rates expectations that we are undergoing. And it might not be over at all as the market is still pricing 39 bps of easing by year-end and 100 bps cumulatively by the end of 2026 compared to 75 bps projected by the Fed.
In the bigger picture, gold should remain in an uptrend as real yields will likely continue to fall amid the Fed’s dovish reaction function. In the short-term though, hawkish repricing in interest rates expectations caused by strong US data will likely keep on triggering corrections.
Next week, we have major data releases with ISM PMIs and lots of US labour market data which is what the Fed is most focused on right now. The ADP and NFP will be the main events.
Gold Technical Analysis – Daily Timeframe

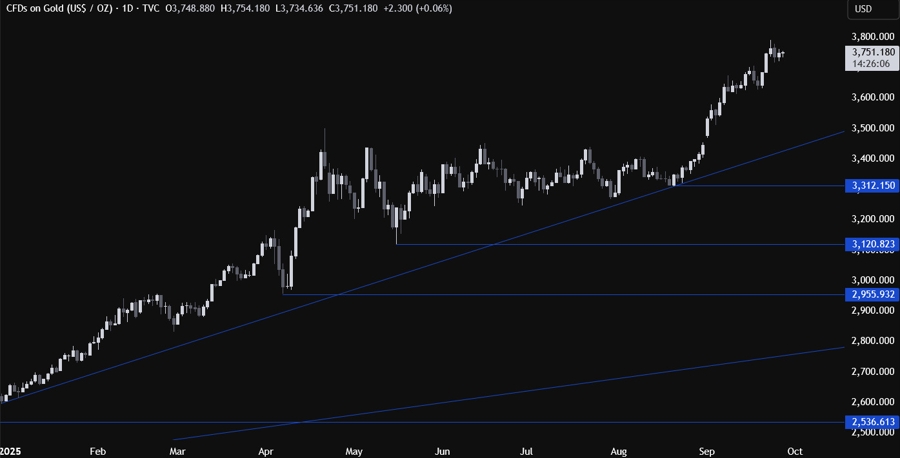
On the daily chart, we can see that gold went into some consolidation this week as headwinds like higher yields and US dollar weighed on the market. From a risk management perspective, the buyers will have a better risk to reward setup around the major trendline, while the sellers will look for a break lower to extend the drop into the 3,120 level next. Such a big correction though, will likely need strong US data to trigger a hawkish repricing in interest rates expectations.
Gold Technical Analysis – 4 hour Timeframe

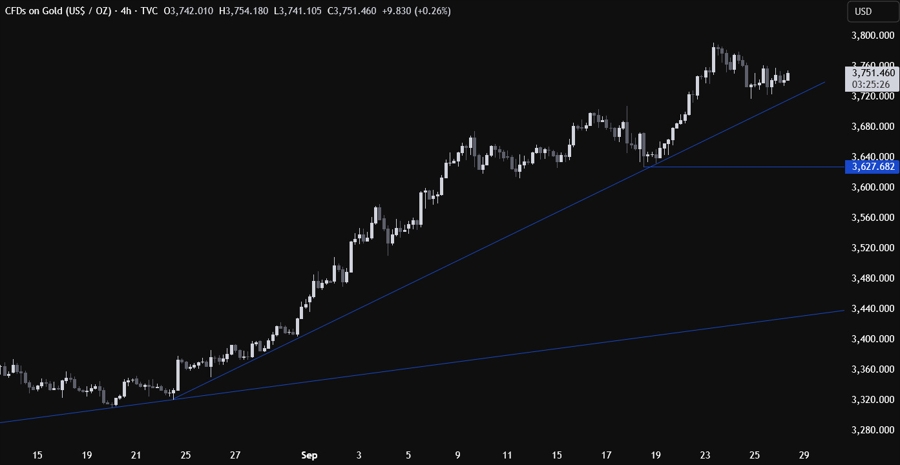
On the 4 hour chart, we can see that we have another minor upward trendline defining the bullish momentum on this timeframe. If we get a pullback into the trendline, we can expect the buyers to lean on it with a defined risk below it to position for a rally into a new all-time high. The sellers, on the other hand, will want to see the price breaking lower to pile in for a drop into the 3,627 level next.
Gold Technical Analysis – 1 hour Timeframe

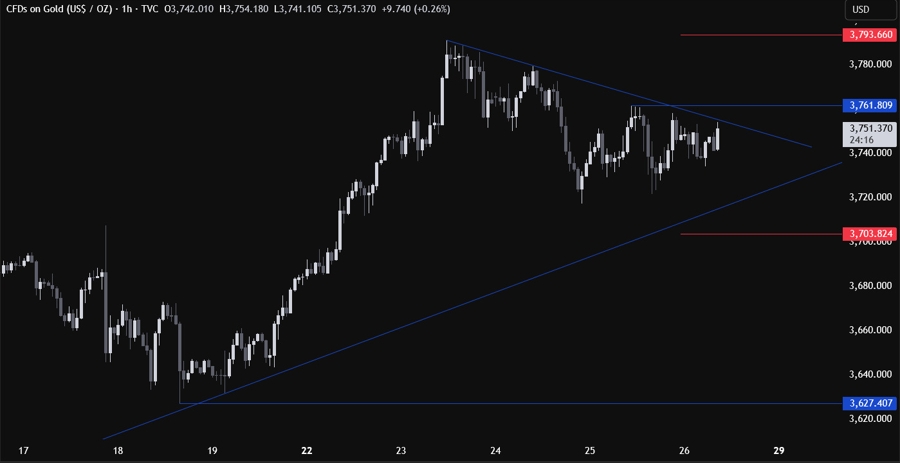
On the 1 hour chart, we can see that we have a bit of a consolidation around the highs. The minor downward trendline is defining the pullback. The sellers will likely continue to lean on the trendline to keep pushing into new lows, while the buyers will want to see the price breaking higher and above the 3,761 level to pile in for a rally into a new all-time high. The red lines define the average daily range for today.
Upcoming Catalysts
Today we conclude the week with the US PCE and the final University of Michigan consumer sentiment report.


