Fundamental Overview
Gold jumped into a new all-time high on Friday following another soft NFP report. The dovish bets on the Fed increased as a result and the market is now expecting three rate cuts by year-end. Moreover, we have also an 8% probability of a 50 bps cut in September but that will likely happen only if we get a soft CPI report on Thursday. In that case, gold might get another boost.
The fundamentals for gold have been positive for months and years, but more recently the dovish Powell’s tilt at the Jackson Hole Symposium acted as a catalyst for the rally into new all-time highs. In fact, real yields kept on falling steadily supported by stronger dovish bets and weaker US data.
Looking ahead, we have the US CPI report on Thursday and then the FOMC meeting next week. In the bigger picture, gold should remain in an uptrend as real yields will likely continue to fall amid Fed easing given their dovish reaction function. In the short-term though, hawkish repricing in interest rates expectations will likely keep on triggering corrections.
Gold Technical Analysis – Daily Timeframe
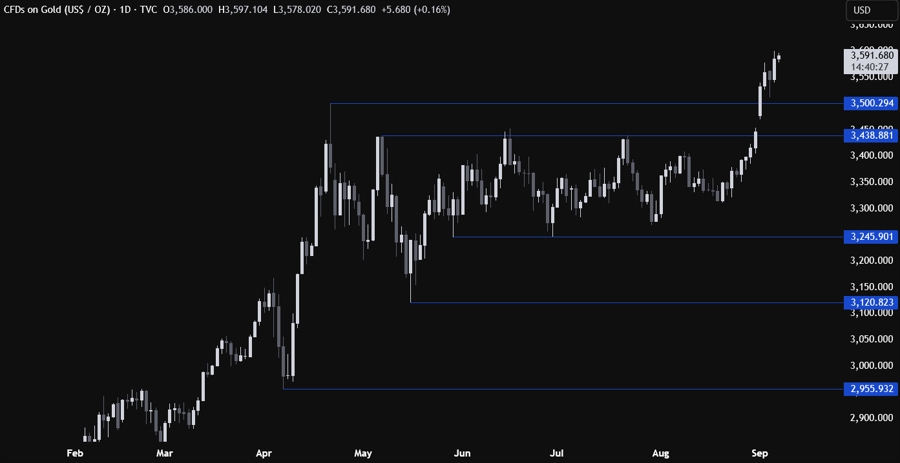
On the daily chart, we can see that after breaking into new all-time highs, gold eventually extended the rally into the 3,600 level where it stalled. From a risk management perspective, the buyers will have a better risk to reward setup around the prior all-time high at 3,500. The sellers, on the other hand, will look for a break below the 3,500 level to start targeting the 3,245 level next.
Gold Technical Analysis – 4 hour Timeframe
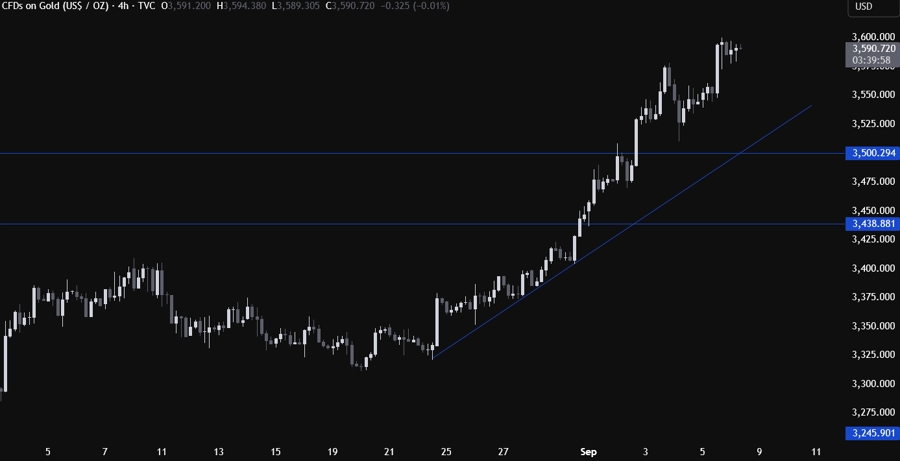
On the 4 hour chart, we can see that we have an upward trendline defining the bullish momentum. If we get a pullback into the trendline, we can expect the buyers to lean on it with a defined risk below it to keep pushing into new highs. The sellers, on the other hand, will look for a break lower to increase the bearish bets into the 3,245 level next.
Gold Technical Analysis – 1 hour Timeframe
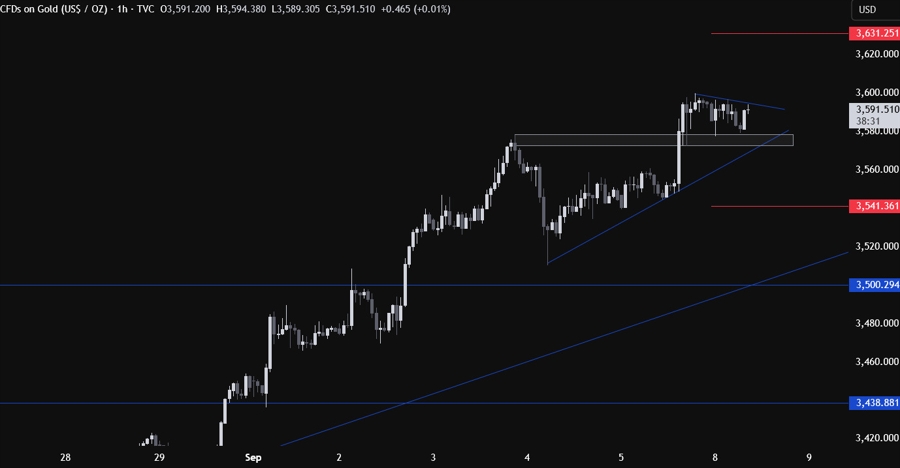
On the 1 hour chart, we can see that we have another minor upward trendline and a minor support zone around the 3,575 level. The buyers will likely continue to step in around the support with a defined risk below the trendline to keep pushing into new highs, while the sellers will look for a break below the trendline to position for a pullback into the major trendline next.
On an intraday basis, if the momentum remains strong, the buyers will likely pile in on a break above the counter trendline. The red lines define the average daily range for today.
Upcoming Catalysts
On Wednesday we have the US PPI report. On Thursday, we get the US CPI report and the latest US Jobless Claims figures. On Friday, we conclude the week with the University of Michigan Consumer Sentiment report.


