Fundamental Overview
Gold managed to push into yet another all-time high today. This bullish momentum has been building since Friday. The market continues to run by inertia as we haven’t got any strong negative catalyst.
Nonetheless, the Fed didn’t match the very dovish rate path priced in by the market and that could mean that strong US data could trigger a hawkish repricing in interest rates expectations, especially considering the current divergence between the market pricing and the Fed’s forecast.
This in turn could offer a pullback which would be similar to what happened last year. In the bigger picture though, gold should remain in an uptrend as real yields will likely continue to fall amid the Fed’s dovish reaction function. In the short-term, hawkish repricing in interest rates expectations will likely keep on triggering corrections.
Gold Technical Analysis – Daily Timeframe
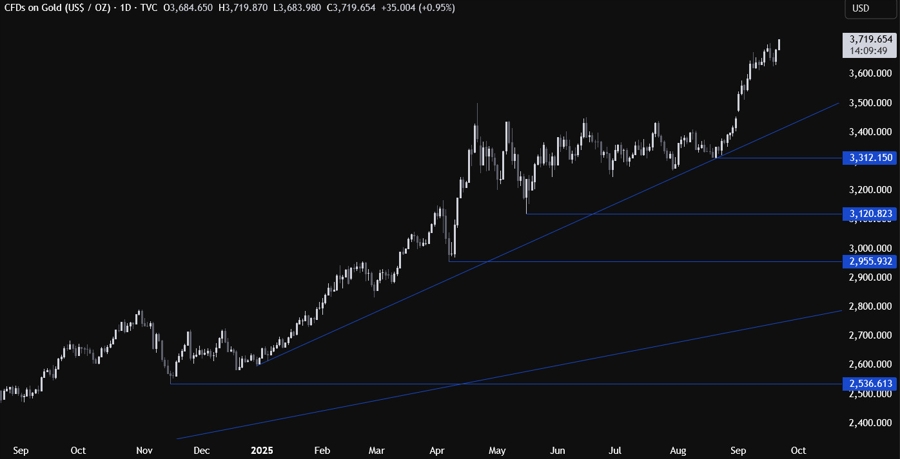
On the daily chart, we can see that gold managed to set yet another all-time high today. From a risk management perspective, the buyers will have a better risk to reward setup around the major trendline, while the sellers will look for a break lower to extend the drop into the 3,120 level next. Such a big correction might happen if we get strong US data that triggers a hawkish repricing in interest rates expectations.
Gold Technical Analysis – 4 hour Timeframe
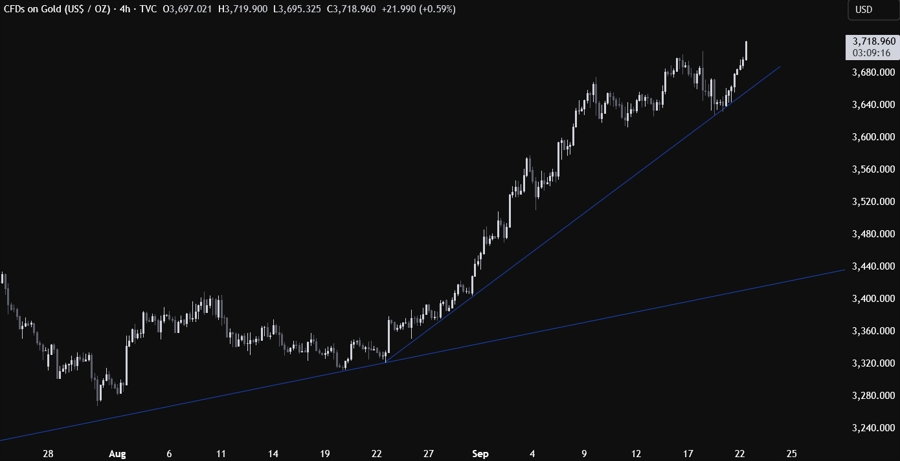
On the 4 hour chart, we can see that the price bounced from the minor upward trendline around the 3,630 level. The buyers will likely continue to lean on the trendline to keep pushing into new highs, while the sellers will look for a break lower to pile in for a drop into the major trendline.
Gold Technical Analysis – 1 hour Timeframe
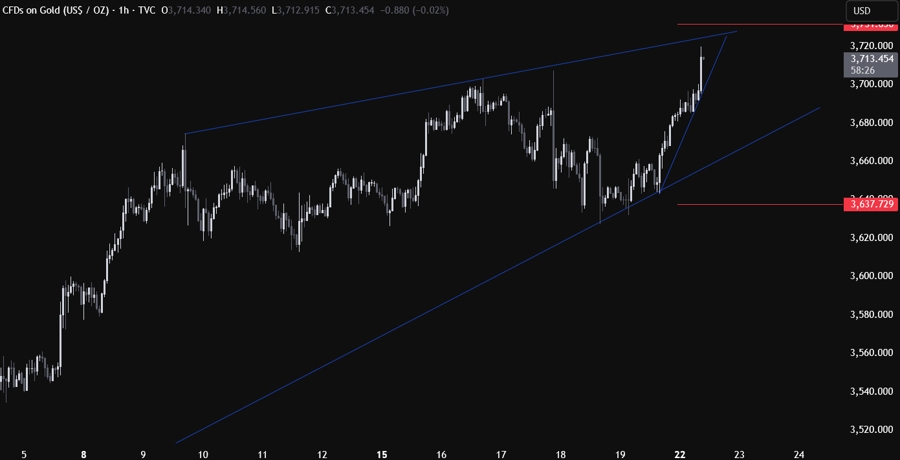
On the 1 hour chart, we can see that we have the top trendline around the 3,723 level that could act as resistance. The sellers will likely step in around these levels with a defined risk above the trendline to position for a pullback into the minor upward trendline. The buyers, on the other hand, will want to see the price breaking higher to increase the bullish bets into new highs, although it might not happen today given that the price is already trading near the top of the average daily range for today.
Upcoming Catalysts
Tomorrow we have the US Flash PMIs and Fed Chair Powell speaking. On Thursday, we get the latest US Jobless Claims figures. On Friday, we conclude the week with the US PCE report.


